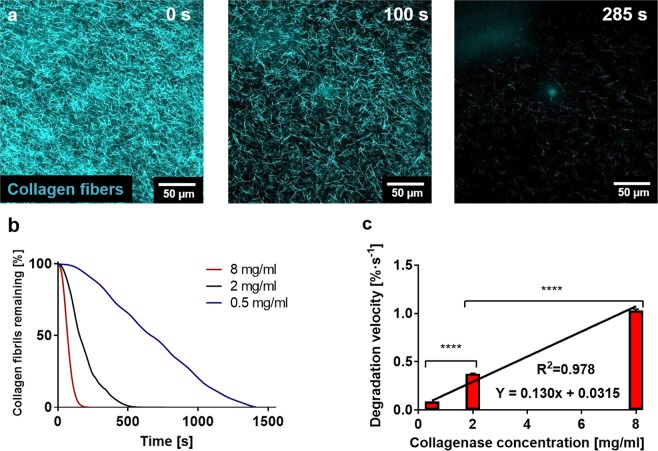
Figure 2.
Optimisation of the enzymatic degradation of collagen hydrogels. (a) Confocal reflection microscopy of the degradation dynamics of a collagen hydrogel on a glass-bottomed Petri dish using an 8 mg/ml solution (18 IU/ml of collagenase P in PBS. The pictures show how the number of collagen fibrils constituting the hydrogel decreases over time. (b) Quantification of the hydrogel degradation dynamics for different collagenase concentrations through area quantification for 0.5, 2 and 8 mg/ml. (c) Characterisation of the degradation speed for the different collagenase concentrations. Linear fitting of the degradation speeds resulted in a linear equation (Y = 0.130x + 0.0315) R2 = 0.978. Graph shows average ± SEM (p-values < 0.001 in both cases).

