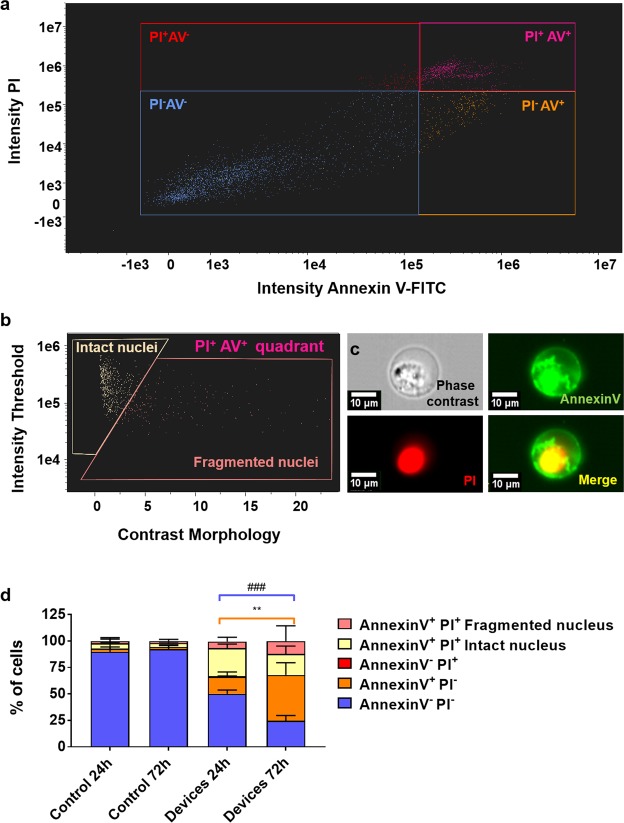
Figure 7.
Validation of the degradation method for downstream AMNIS flow cytometry with individual cell imaging capabilities. (a) Sample flow cytometry 2D plot of the cell death analysis from cells extracted from a microfluidic device after 72 h of culture. (b) Breakdown of Annexin V+PI+ cells from the plot shown in 7a and elucidation of their phenotype according to contrast morphology classification of nucleus integrity. (c) Single-cell sample fluorescent images of a recovered necroptotic cell (Annexin V+PI+ and solid nucleus in PI staining channel). Phase contrast (top-left), Annexin V-FITC (top-right), Propidium iodide (bottom-left) and merge of the two latter (bottom-right). Single-cell images were used for discerning cell phenotypes, including necroptotic (intact nucleus) and apoptotic (inhomogeneous nucleus) phenotypes among Annexin V+PI+ cells. (d) Graph showing the measured percentage of different cell phenotypes in the microdevices after 24 and 72 hours, according to Annexin V and PI staining and nucleus integrity for Annexin V+PI+. Controls in 2D at 24 and 72 hours are also shown to validate the staining and cell viability. Annexin V−PI− and Annexin V+PI− yielded statistically significant results after a two-way ANOVA (**p-value = 0.0011 and ###p-value = 0.0006 respectively) with a Tukey correction for multiple comparisons. Conversely, the controls were not significantly different from each other (p-value > 0.96 in all cases) and demonstrated the staining for all the described populations.

