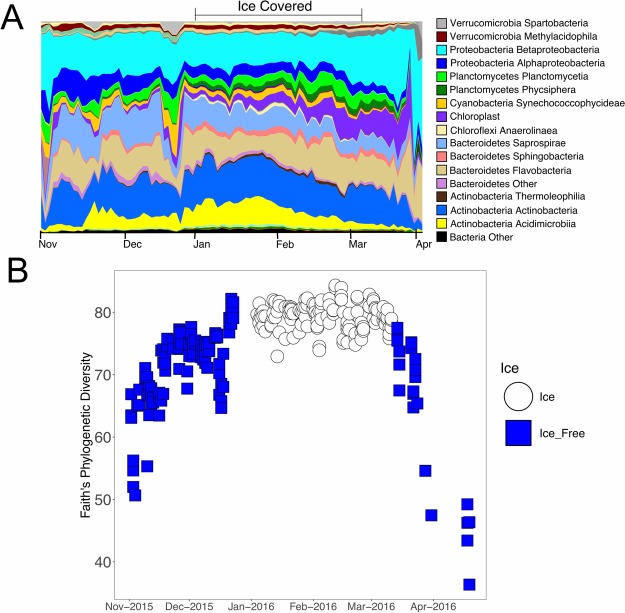
Figure 3.
Microbial diversity across the timeseries. (A) Taxonomic area chart of microbial orders. Relative abundance of microbial orders are shown as different colors across the timeseries. Orders with abundance of less than 0.1% were grouped together in the other category. The corresponding colors for each microbial order are shown in the legend. (B) Faith’s Phylogenetic Diversity as a function of time. Samples collected during ice-free times are shown in blue squares. Samples collected during ice-covered times are shown in white circles.

