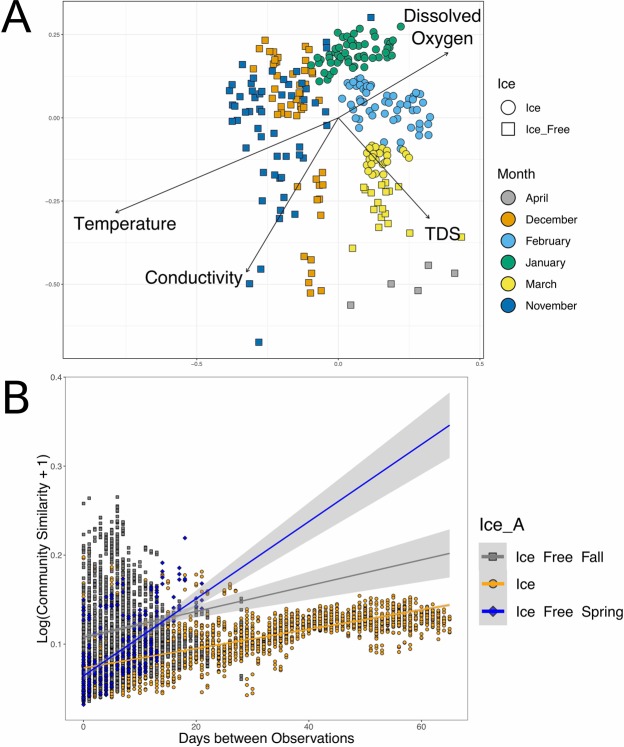
Figure 4.
Microbial community composition changes during the time series. (A) Non-metric multidimensional scaling (NMDS) of weighted unifrac distances. The shape of the points corresponds to the ice condition and the color corresponds to month of collection. Stress for this plot is 0.1878. Environmental factors were fit to the NMDS and factors that significantly fit the data are shown as vectors. (B) Time-decay analysis of weighted-unifrac distances. Pairwise comparison of community distances versus number of days between treatment. Data was fit to a linear regression. Confidence regions are represented as gray shading. Ice-covered samples are shown in orange. Ice-free communities in the fall are shown in gray, and ice-free communities in the spring are shown in blue.

