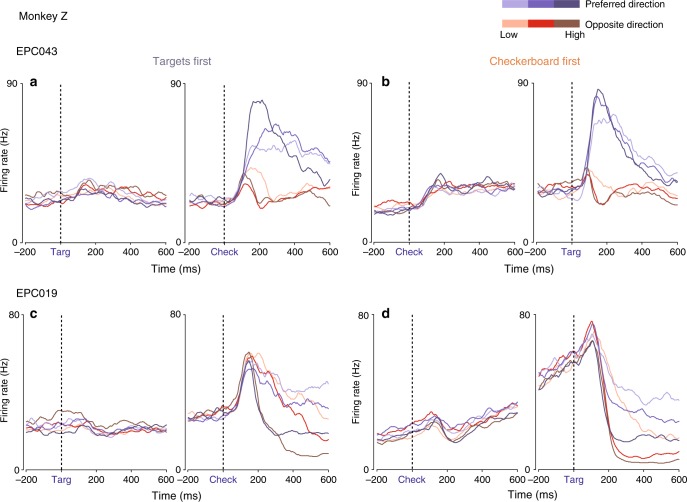
Fig. 3.
Example units with responses to the first visual cues of each task. See also Supplementary Figure 2. a, b Unit EPC043 emitted a transient increase in activity detected at 160 ms after the Targets appeared in the TF task (a), and a stronger sustained response beginning 140 ms after the appearance of the checkerboard in the CF task (b). c, d Unit EPC019 emitted a small rise in activity that was detected at 240 ms after Targets appearance in the TF task (c). In the CF task (d), there was a brief increase in activity detected at 140 ms after the appearance of the checkerboard, followed by a transient suppression and then a pronounced ramp increase for the remaining duration of the Checkerboard-observation period

