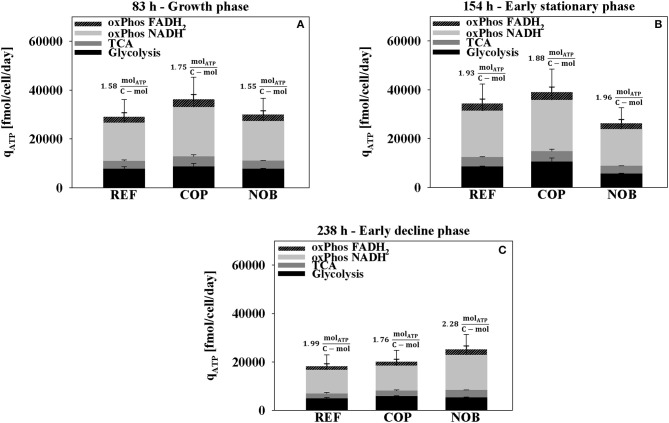
Figure 6.
ATP production rate during growth phase (A), early stationary phase (B), and early decline phase (C) for the three process settings divided into the origin of ATP formation. Values for oxidative phosphorylation include NADH or FADH2 produced in both glycolysis and TCA. ATP directly from TCA originates from succinyl-CoA synthetase. Results were obtained from the flux balance analysis. Errors were determined through Monte Carlo sampling of the solution space of each the bioreactor cultivations in triplicates.

