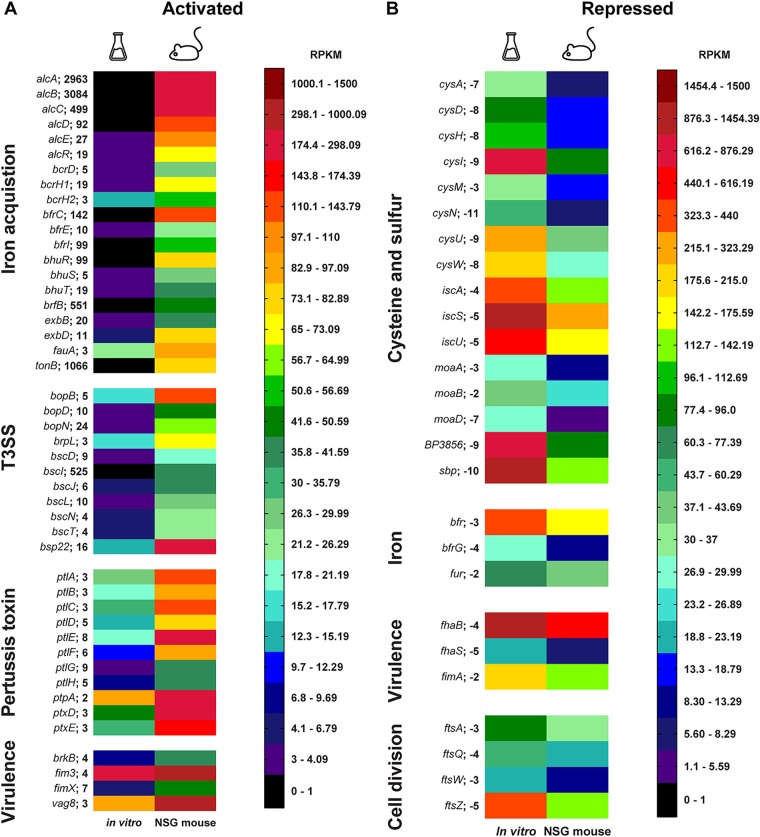
FIG 5.
Heat map visualization of in vivo-activated and -repressed genes organized by function. The average number per million mapped reads (RPKM) is denoted by the color scale. The maximum value of the scale is set at 1,500 RPKM (red), and the minimum is at 0 RPKM (black). The distribution of the color scale of 24 colors is divided by the total number of data points per range. The Erlenmeyer flask represents in vitro conditions, and the mouse represents in vivo conditions. (A) Activated groups in vivo compared to expression in vitro include iron acquisition, type III secretion system (T3SS), pertussis toxin, and other virulence factors. (B) Repressed groups in vivo compared to expression in vitro include cysteine and sulfur, cell division, iron, and virulence factors. The average fold change in vivo compared to that in vitro is noted on the right of the gene name, and all genes shown were statistically significant.

