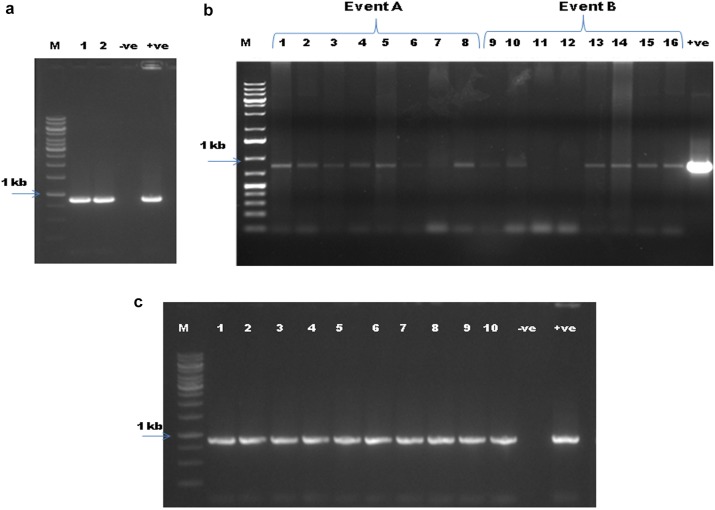
Fig. 4.
Analysis of transgenic plants for presence of CP4-EPSPS gene. a Screening of T1 transgenic plants using EPSPS primers. b Screening of T2 transgenic plants. c Screening of T3 transgenic plants. Lanes: M marker 1 kb. Numbers 1, 2, 3, etc. represent respective samples, − ve is the negative control, + ve is the positive control

