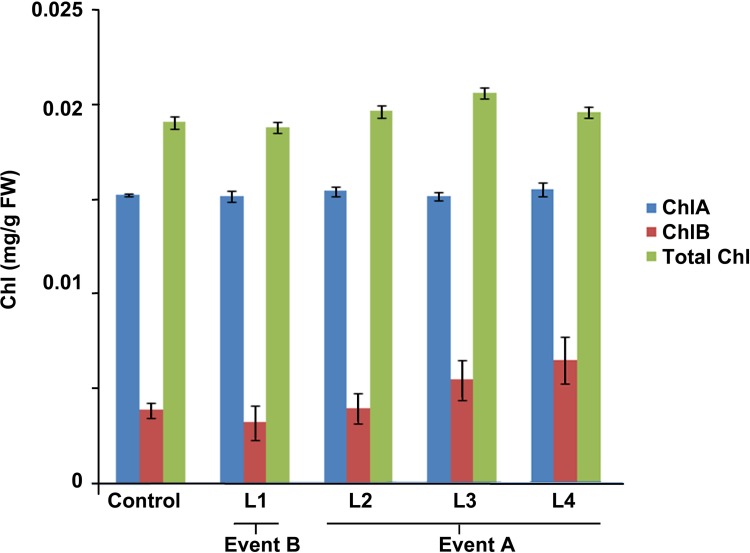
Fig. 7.
Comparison of chlorophyll a, b and total chlorophyll in T3 transgenic and non-transgenic control wheat plant. Event B line L1, and Event A lines L2, L3 and L4 represent transgenic lines. The significant difference values are been shown by asterisk, and the data are the mean of five replicates

