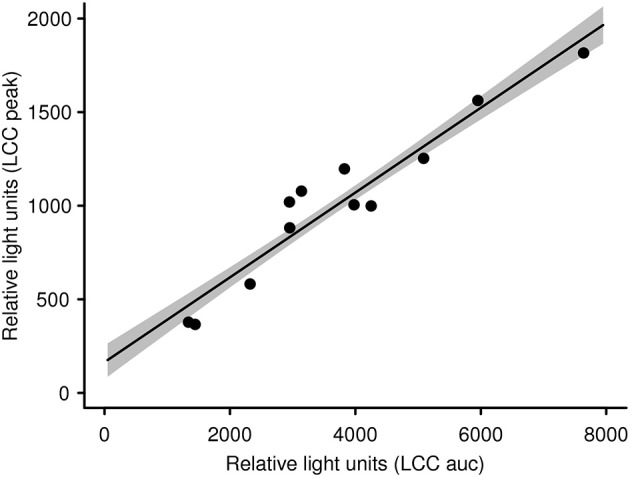
Figure 2.

LCC peak levels in kulan are significantly linked with and therefore representative for the whole LCC curve (i.e., area under the curve; see also Figure S1). The gray shaded area represents the standard error of the slope.

LCC peak levels in kulan are significantly linked with and therefore representative for the whole LCC curve (i.e., area under the curve; see also Figure S1). The gray shaded area represents the standard error of the slope.