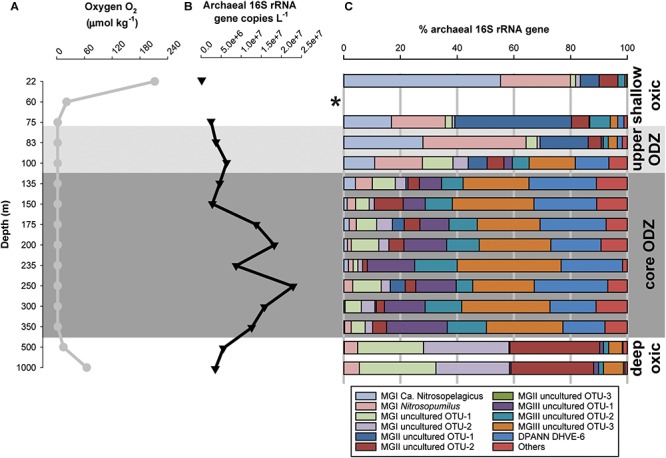
FIGURE 3.

(A) Concentration profile of oxygen (O2, μmol kg-1), (B) absolute number of total archaeal 16S rRNA gene (copies L-1), and (C) percentage of the archaeal 16S rRNA gene reads of the archaeal groups detected across the ETSP water column at the coastal station. ∗At 60 m depth only 4 of the 8,127 recovered sequences were derived from archaea (0.1% of archaeal 16S rRNA gene reads), therefore we did not further consider this sample for analysis neither for discussion.
