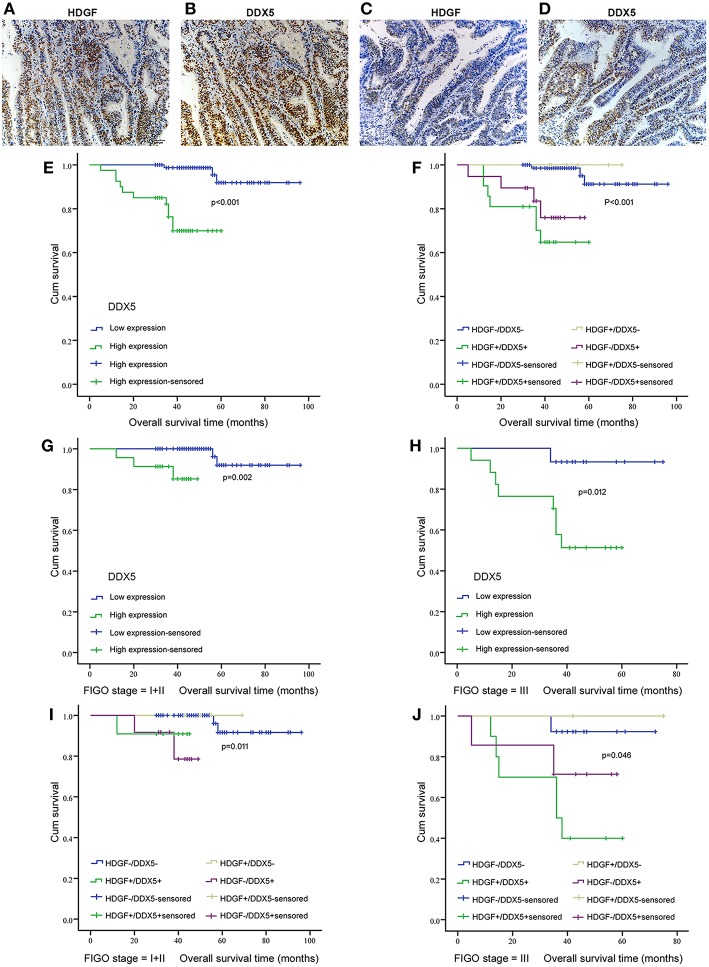
Figure 7.
Correlation between HDGF and DDX5 in EC tissues and the clinical significance. Immunohistochemistry results showing the level of HDGF and DDX5 expression at the same locations in EC tissues. (A,B) represent high expression of HDGF and DDX5, respectively. (C,D) represent low expression of HDGF and DDX5, respectively. Original magnification 200×. We analyzed DDX5 expression in the primary tumors of patients with EC (E) and the correlation between HDGF high expression and prognosis for patients with EC by strata analysis against FIGO stage (G,H). Kaplan-Meier survival curve comparing subgroups based on HDGF and DDX5 expression in the primary tumors of patients with EC. Low HDGF expression cases with high or low DDX5 expression, as well as high HDGF expression cases with high or low DDX5 expression (F–J). The P-value is based on a log-rank test.

