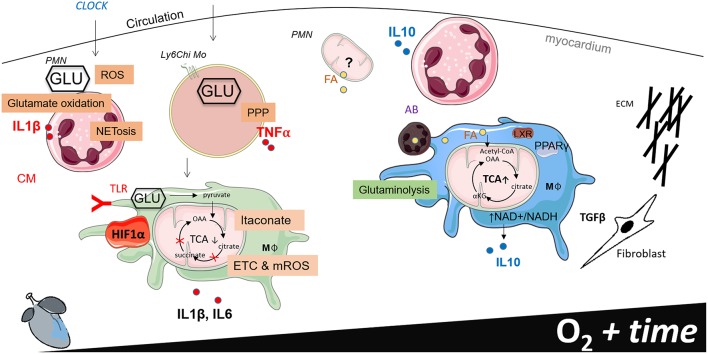
Figure 2.
Working model of phagocyte immunometabolism after myocardial infarction (MI). This figure separates cardiac inflammation based on time (the first week post MI) and oxygen saturation within the infarct border zone. Little information is known about the functional metabolic capacity of macrophage CCR2 and MHCII resident and recruited subsets in the heart, therefore generalizations are made to classify macrophages according to metabolic phenotype.

