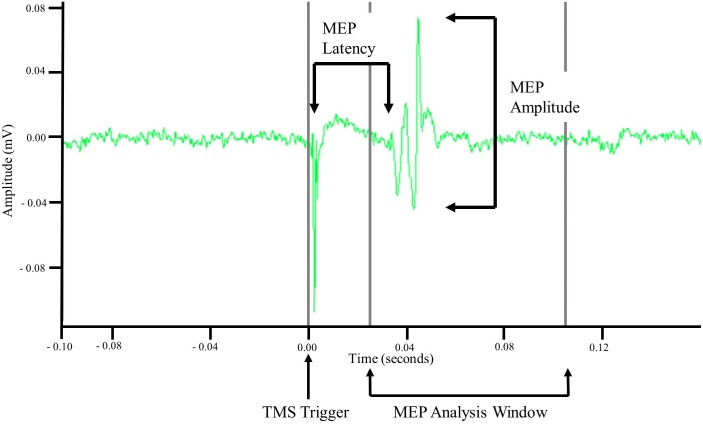
FIGURE 2.
Example motor evoked potential (MEP) recorded via surface electromyography. Unprocessed surface electromyographic signal recorded after a single TMS pulse was applied to cortical representation of the tibialis anterior (TA) muscle. MEP amplitude was measured as the difference in minimal and maximal amplitude of the signal within an 0.08 s analysis window that began 0.025 s after application of the TMS pulse. MEP latency was measured as the time between the TMS pulse and the initiation of the MEP.

