Figure 3.
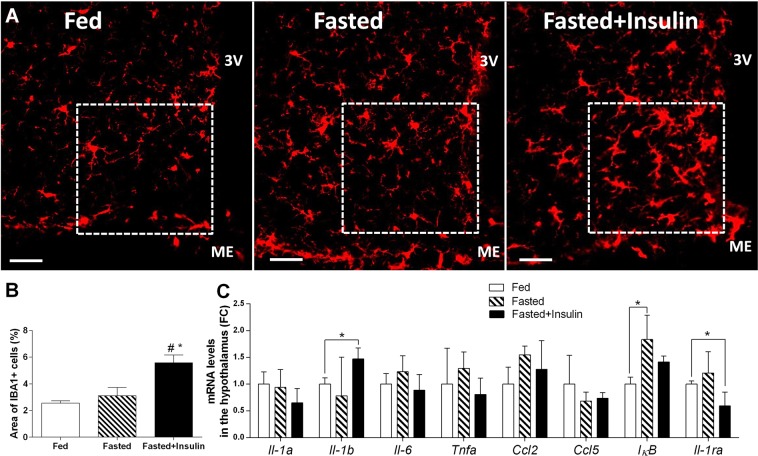
Hypoglycemia recruits microglia in the hypothalamus. (A) Representative photomicrographs, showing ionized calcium-binding adaptor molecule 1 (IBA1) immunoreactive (-ir) microglia in ARC of fed, fasted and fasted + insulin-injected mice. Scale bars, 20 µm. 3 V: third ventricle, ME: median eminence. (B) Mean ± SEM percentages of the area covered by IBA1-immunoreactivity per unit area in ARC (n = 3 per group). ROIs are shown on images. (C) Mean ± SEM values of relative mRNA levels of proinflammatory cytokines (Il-1a Il-1b, Il-6, Tnfa) chemokines (Ccl2, Ccl5) and IκB, Il-1ra in hypothalamus (n = 4 per groups). Fed: fed, saline-injected group; Fasted: O/N fasted, saline-injected group; Fasted + insulin: O/N fasted, insulin-injected group. All data on the figure expressed as mean ± SEM. *p < 0.05 vs. fed; #p < 0.05 vs. fasted as determined by Bonferroni post hoc test.

