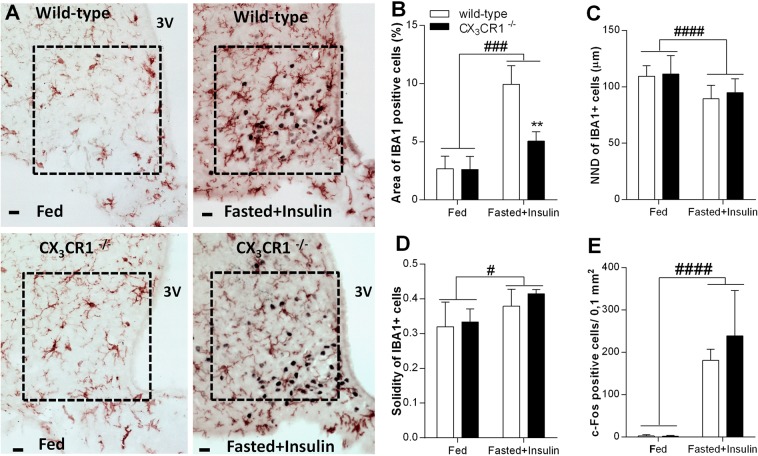
Figure 6.
Neuron-microglia communication is critical for microglia activation in insulin-induced hypoglycemia. (A) Photomicrographs showing c-FOS (black cell nuclei) and IBA1-ir profiles (brown) in arcuate nucleus of wild-type and fractalkine receptor deficient (CX3CR1−/−), fed + vehicle treated and fasted + insulin-treated mice. Note microglia accumulation close to c-FOS expressing neurons in wild-type, fasted + insulin treated animals. Scale bar: 20 µm; 3 V: third ventricle. (B–D) Quantitative analysis of microglia population in arcuate nucleus (n = 3 per groups). (B) Area % occupied by IBA1 positive profiles; (C) Nearest neighbor distance; (D) Solidity index; (E) Number of c-FOS positive cells in arcuate nucleus of wild-type and CX3CR1−/−, fed or fasted + insulin-treated mice (n = 3 per group). Mean ± SEM values. Two way ANOVA: significant treatment effect indicated by #p < 0.05, ###p < 0.001, ####p < 0.0001 and genotype effect indicated by **p < 0.01. Fed: fed, saline-injected group; Fasted + Insulin: O/N fasted, insulin-injected group.

