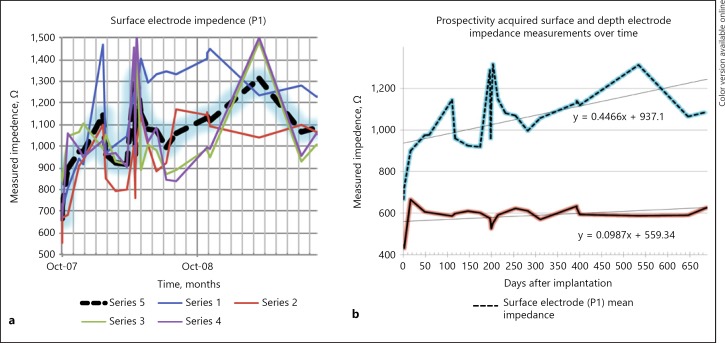
Fig. 2.
a Surface electrode impedance over time. Series 1, 2, 3, and 4 represent the respective surface electrode contacts. Series 5 represents the mean impedance. b Prospectively acquired surface and depth electrode impedance measurements over time. Surface electrode (above, dashed line, P1, indicated in Fig. 1) mean impedance vs. depth electrode mean impedance (below, continuous line) over time.

