Figure 5.

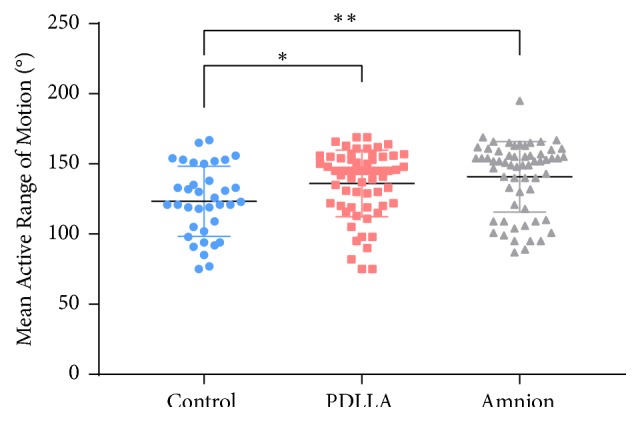
Mean range of motion at follow-up assessments by visit. The PDLLA group (n=34) and amnion group (n=33) were significantly different from the control group (n=20). ∗: p<0.05; ∗∗: p<0.01.

Mean range of motion at follow-up assessments by visit. The PDLLA group (n=34) and amnion group (n=33) were significantly different from the control group (n=20). ∗: p<0.05; ∗∗: p<0.01.