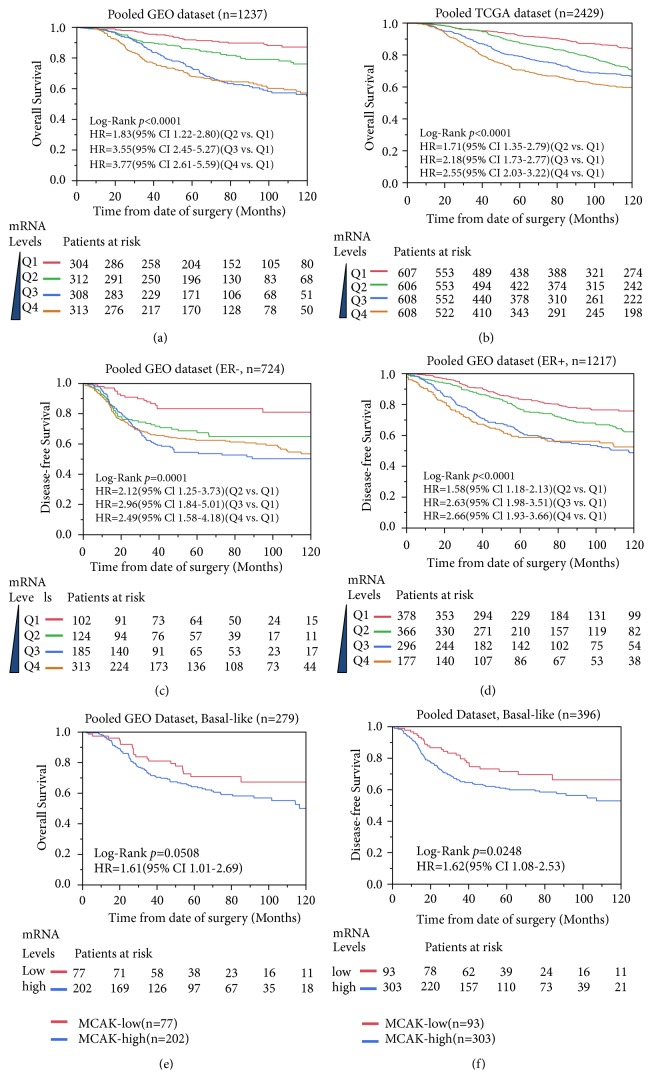
Figure 2.
Survival analysis of MCAK expression in GEO and TCGA breast cancer datasets. The Kaplan-Meier curves were plotted to visualize MCAK expression levels and outcomes in breast cancer cases. The upper panel listed the overall analysis results of MCAK expression in pooled GEO dataset (a) and TCGA dataset (b). In the middle panel, MCAK was significantly associated with disease-free survival in ER-positive (c) and ER-negative (d) breast cancer patients in pooled GEO datasets. MCAK expression was significantly associated with poor disease-free (e) and overall survival (f) in basal-like breast cancer cases.

