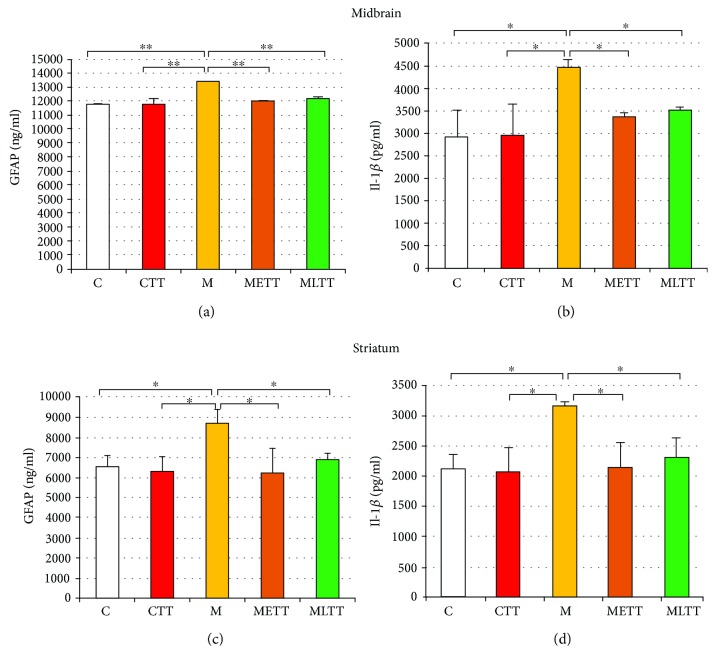
Figure 4.
The quantitative analysis of glial fibrillary acid protein (GFAP) (a, c) and interleukin 1 beta (Il-1β) (b, d) concentration in the midbrain (a, b) and striatum (c, d). C: control; CTT: control + treadmill training; M: treatment with MPTP; METT: MPTP + early onset treadmill training; MLTT: MPTP + late-onset treadmill training group. Statistical comparisons were performed with one-way ANOVA, followed by Newman-Keuls post hoc test; ∗∗p < 0.001, ∗p < 0.05.

