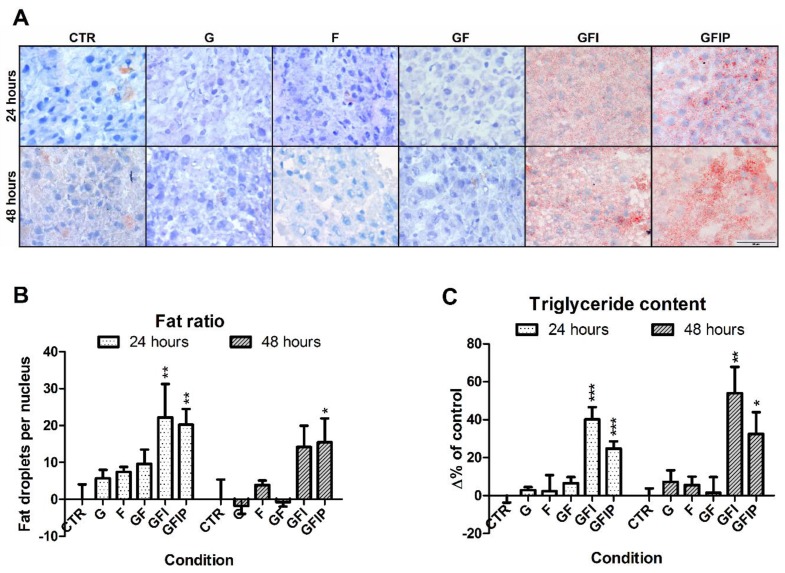
Figure 2.
(A) Representative Oil Red O stained PCLS sections, cultured in different culture media, for 24 h and 48 h. CTR = control, G = Glucose, F = Fructose, GF = Glucose and fructose, GFI = Glucose, fructose, and insulin, GFIP = Glucose, fructose, insulin, and palmitic acid. (B) Fat-to-nucleus ratio. Oil Red O stained sections were used to determine the ratio of fat droplets per nucleus. Data is shown as the mean change in percentage of the ratio ± SEM (N = 4). (C) Difference in measured triglyceride content after 24 h and 48 h. Data is expressed as mean difference in percentages of the 24 h untreated control ± SEM (n = 5–6). Significance was determined using a one-way ANOVA, comparing all conditions from a time point to the control of that time point. * = p-value < 0.05, ** = p-value < 0.01, *** = p-value < 0.001.

