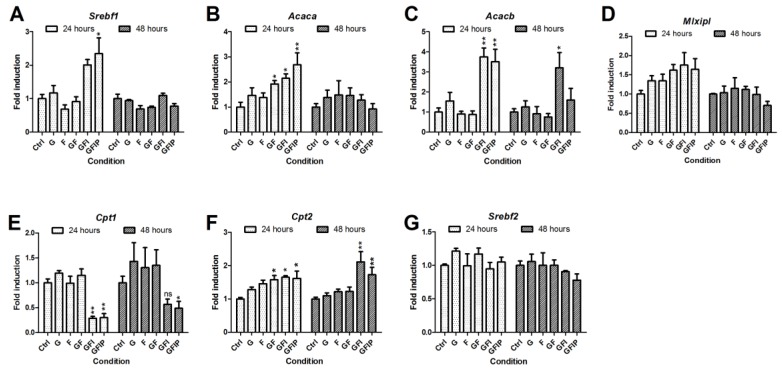
Figure 3.
Relative mRNA expression of genes related to lipid metabolism, specifically (A) Srebf1, (B) Acaca, (C) Acacb, (D) Mlxipl, (E) Cpt1, (F) Cpt2, and (G) Srebf2. Values are displayed as mean fold induction ± SEM (n = 3). Significance was determined using a one-way ANOVA comparing conditions to the 24 h or 48 h control, respectively. * = p-value < 0.05, ** = p-value < 0.01, ns = p-value > 0.05. G = Glucose, F = Fructose, GF = Glucose and fructose, GFI = Glucose, fructose, and insulin, GFIP = Glucose, fructose, insulin, and palmitic acid.

