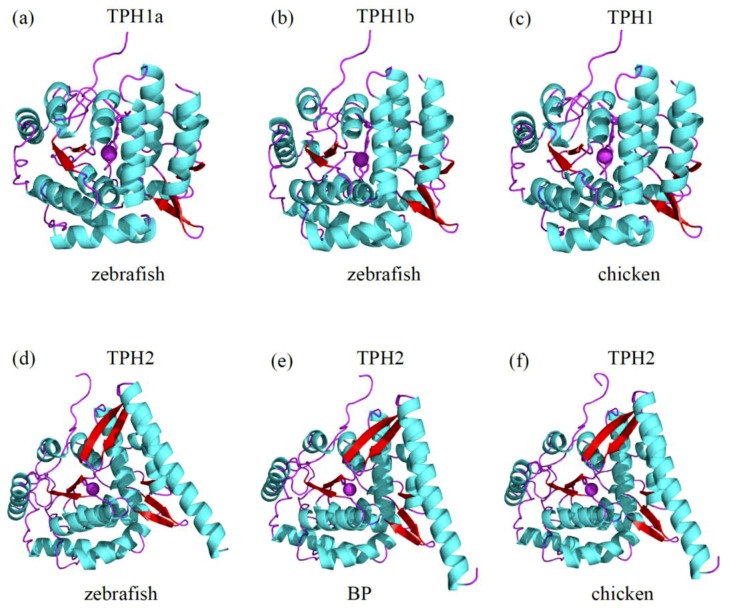
Figure 5.
Predicted 3D structures of representative TPH proteins. Comparisons of the 3D structures of zebrafish TPH1a (a), zebrafish TPH1b (b), chicken TPH1 (c), zebrafish TPH2 (d), BP TPH2 (e), and chicken TPH2 (f) are illuminated in Section 3.5. Helices of the catalytic domains and β-strands are colored sky blue and red, respectively. Loop regions are marked in purple.

