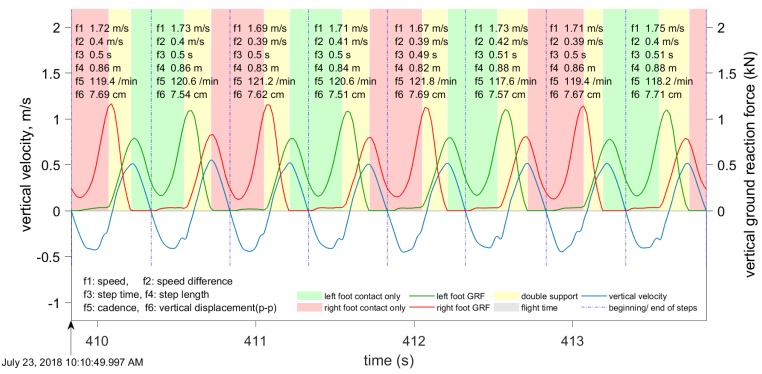
Figure 7.
The segmentation of gait during walking, based on the vertical velocity. The plot shows the vertical velocity (blue), left (green), and right (red) foot force measurements. The following six metrics are displayed for each step: Speed averaged over one step, speed difference peak-to-peak, cadence, step length, step duration, and vertical displacement peak-to-peak.

