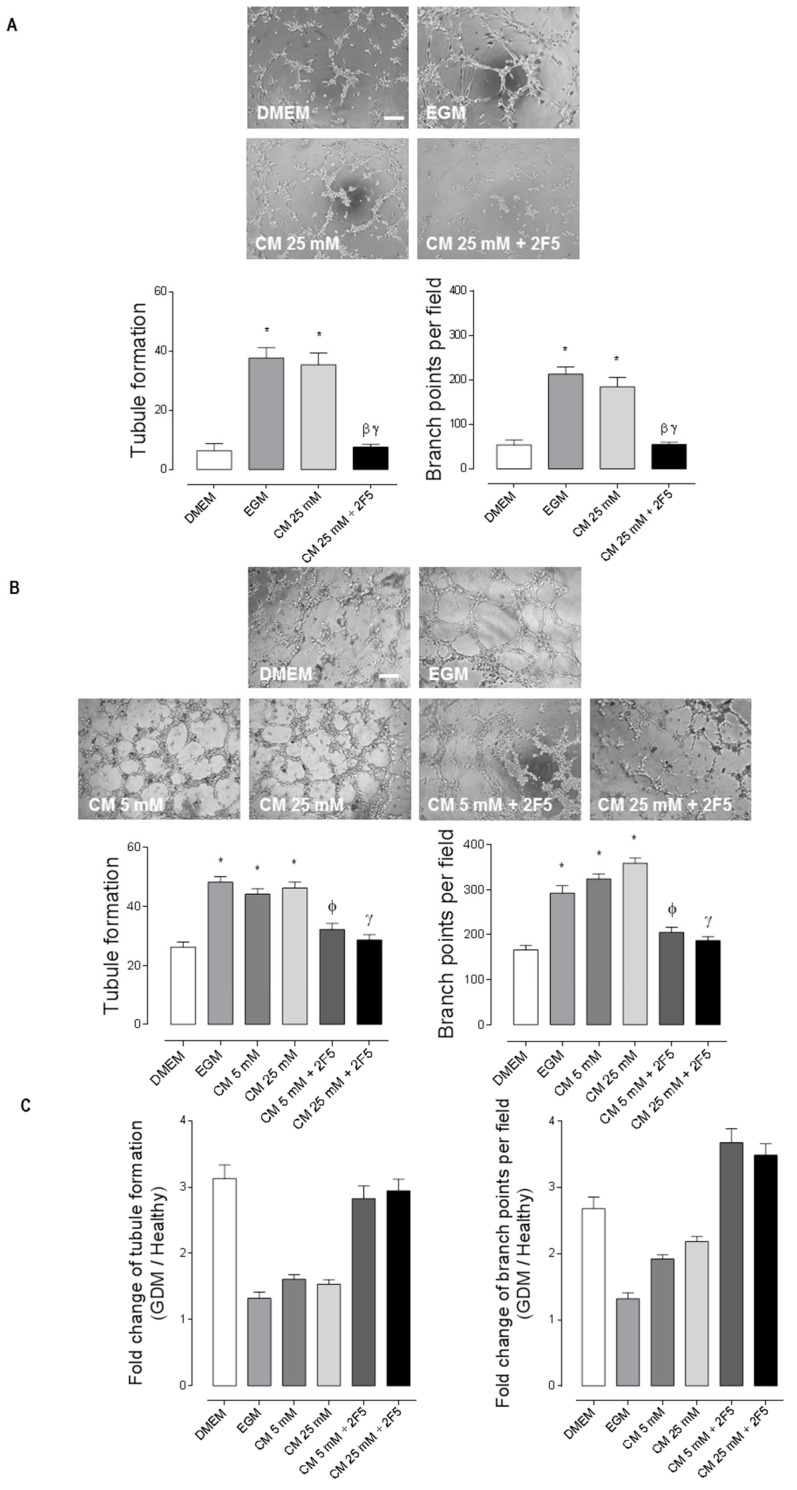
Figure 2.
Netrin-1 produced by healthy WJ-MSC promotes angiogenesis in GDM HUVEC independently of d-glucose condition. (A–C) Representative images of Matrigel tubule formation and branch points per field of either normal HUVEC (A) or GDM HUVEC (B) exposed 4 h to DMEM, EGM or CM (48 h) from WJ-MSC grown in d-glucose as indicated and in absence or presence of 2F5 (2 µg/mL). Scale bar = 15 µm. A. Quantified data correspond to the mean ± S.E.M. (CM WJ-MSC and healthy HUVEC, n = 3, * p < 0.05 vs. DMEM, βp < 0.05 vs. EGM, γp < 0.05 vs. CM 25 mM). (B) Quantified data correspond to the mean ± S.E.M. (CM WJ-MSC and GDM HUVEC, n = 3, * p < 0.05 vs. DMEM, Φp < 0.05 vs. CM 5 mM, γp < 0.05 vs. CM 25 mM). (C) Fold change of tubule formation assay in healthy versus GDM HUVEC. Quantified data correspond to the mean ± S.E.M.

