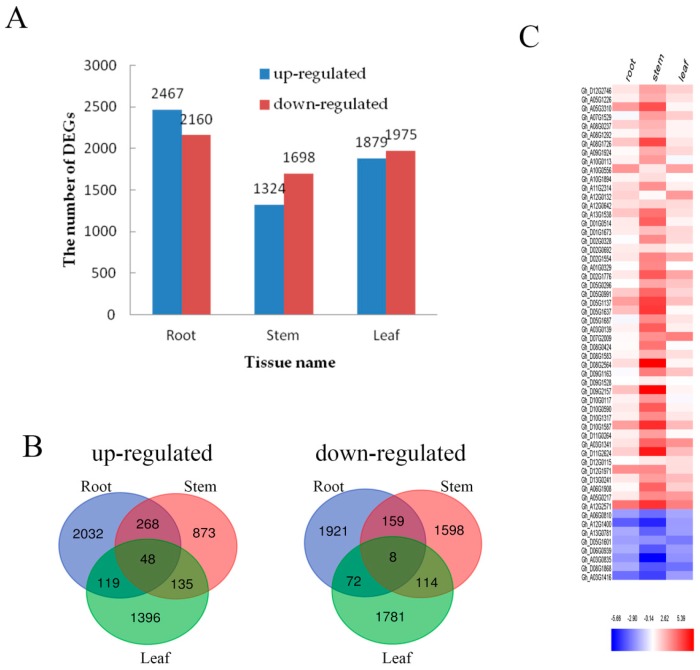
Figure 3.
DEGs in roots, stems and leaves. (A) The number of genes up- or down-regulated by fold change ≥ 2 (p < 0.05) in roots, stems and leaves under Cd stress. (B) Venn diagrams showing the unique and shared regulated genes in cotton roots, stems and leaves under Cd stress; (C) The relative expression analysis of 56 genes that are expressed in roots, stems and leaves. The fold-change ratios of the genes are indicated by the different colors. The red color represents the highest expression, the blue color represents the lowest expression.

