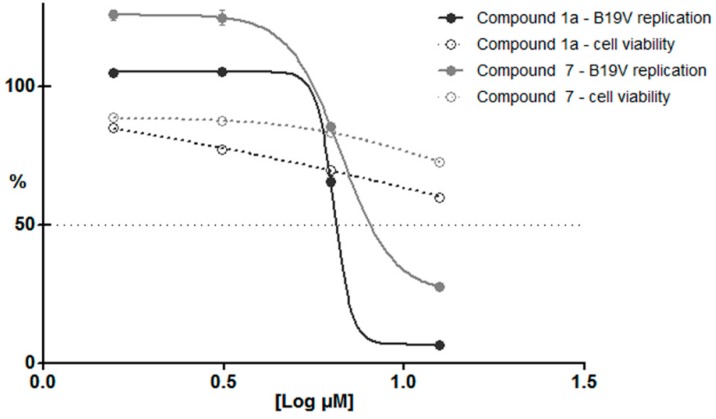
Figure 5.
Viral replication and cell viability, normalized response to compounds 1a and 7 in UT7/EpoS1 cells. Normalized dose-response curves were calculated from qPCR and CCK8 assay data, obtained at 48 hpi for the different experimental series and expressed as percentage values compared to control samples (DMSO 1%).

