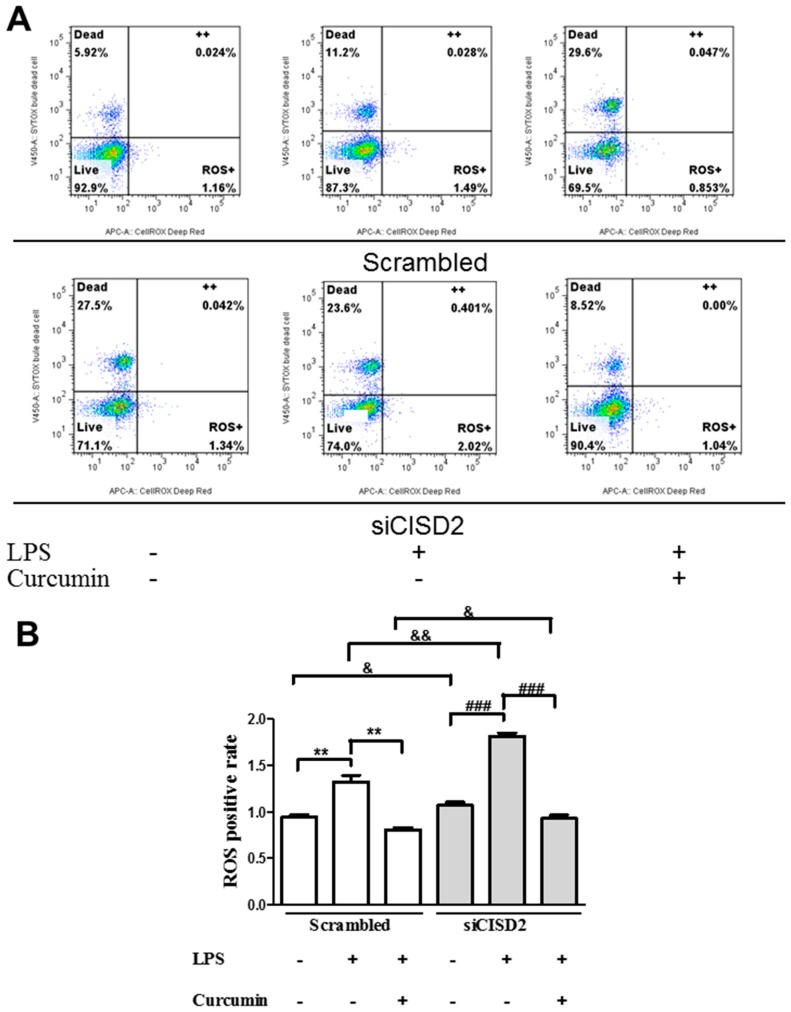
Figure 5.
Reactive oxygen species (ROS) formation in LPS-challenged neural cells (with or without curcumin treatment), as determined by CellROX® Deep Red/SYTOX® Blue Dead Cell stain and flow cytometry with or without CISD2 knockdown. RegionLive: vital cells; Region Dead: dead cells; Region++: dead cells with accumulated ROS; Region ROS+: vital cells with ROS formation. SYTOX ® Blue Dead Cell stain was used to distinguish vital cells from dead cells. ROS+ cells of all groups were analyzed using flow cytometry (A). Representative flow cytometry results from all groups. (B) Bars indicate the mean ± SEM (n = 3). & p < 0.05, &&,** p < 0.01, and ### p < 0.001 indicate differences of statistical significance.

