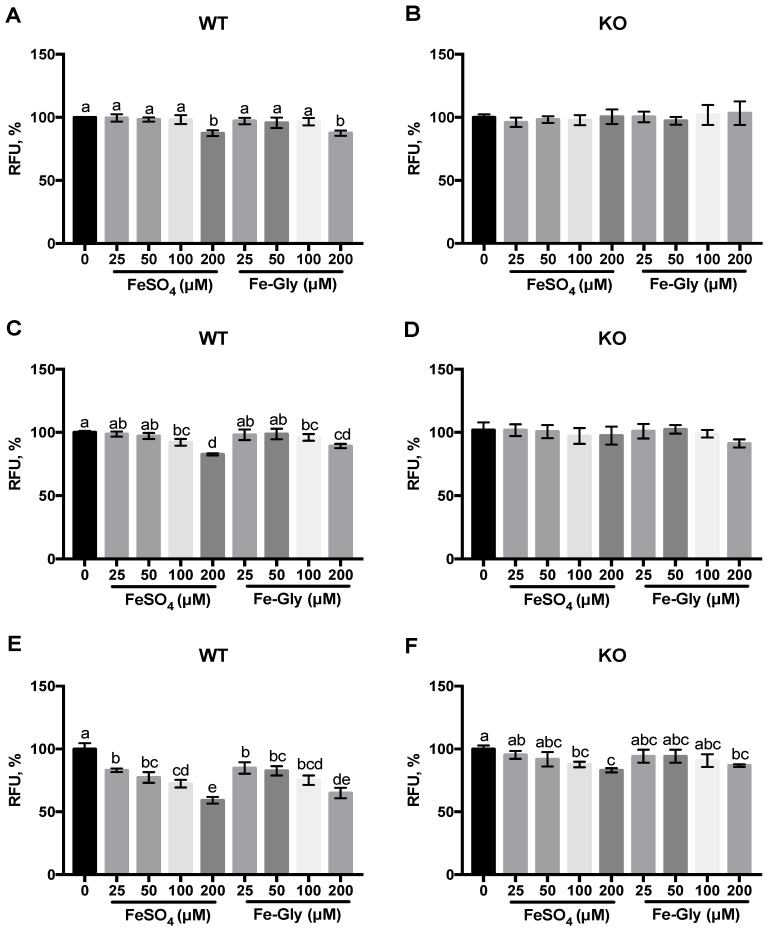
Figure 3.
Changes of labile iron after treatment with different iron sources (0, 25, 50, 100, 200 μM) in wild-type cells and DMT1-knockout cells. Values not sharing a common letter differ significantly (p < 0.05). WT: wild-type Caco-2 cell; KO: DMT1-knockout Caco-2 cell; RFU: relative florescence unit. Changes of labile iron after 0.5 h (A,B), 1 h (C,D), 2 h (E,F) treatment with different iron sources in wild-type cells and DMT1-knockout cells.

