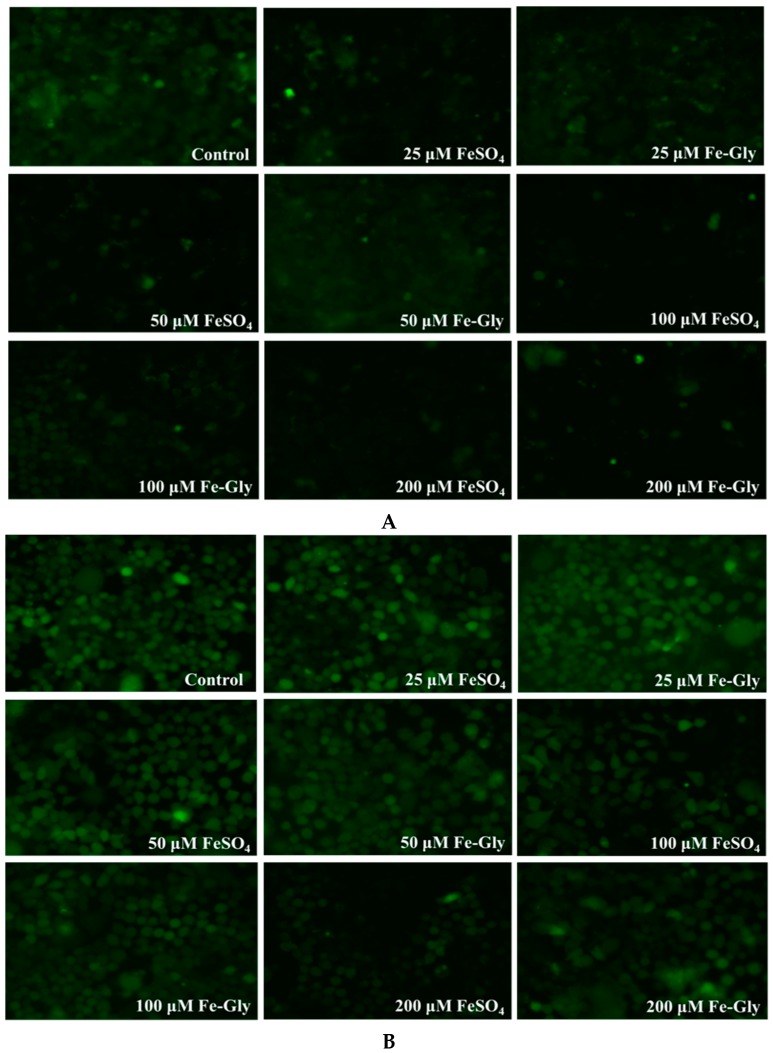
Figure 4.
Live cell fluorescence imaging (200x) of labile iron in wild-type cells and DMT1-knockout cells after treated with different concentrations of FeSO4 and Fe-Gly for two hours. (A) Fluorescence imaging of labile iron in wild-type cells; (B) Fluorescence imaging of labile iron in DMT1-knockout cells.

