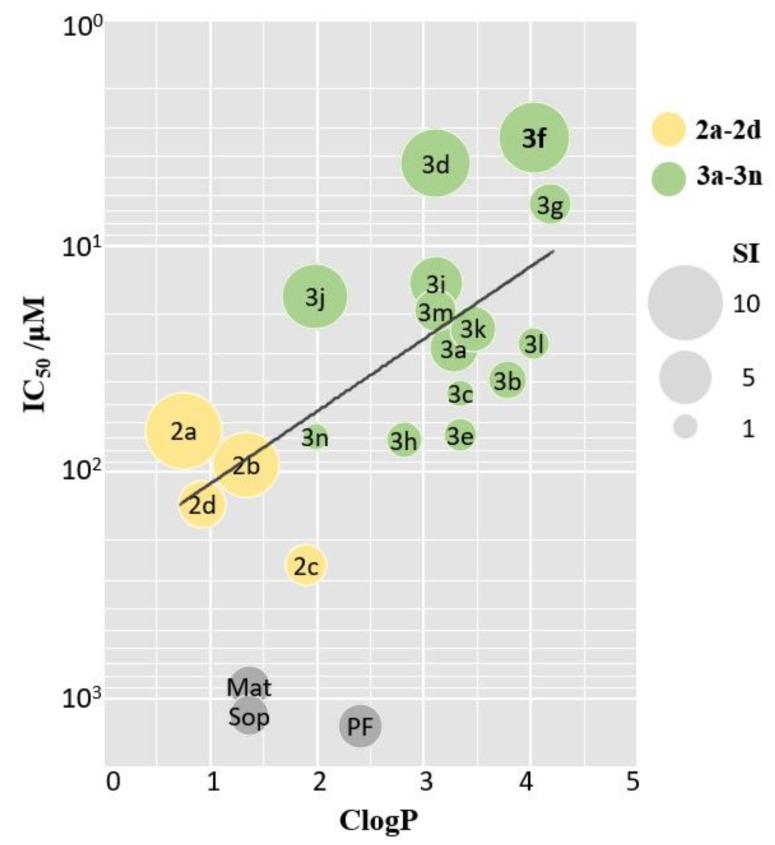
Figure 3.
Bubble chart of ClogP-IC50. X-axis and Y-axis represents ClogP and IC50 values, respectively. Bubble size reflects SI value. Yellow, green, and grey bubbles represent derivatives 2a–d, 3a–n, and positive control, respectively. Mat, Sop, PF was abbreviation for Matrine, Sophocarpine, and Pirfenidone, respectively.

