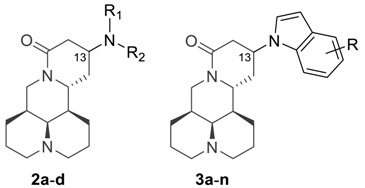
Table 1.
Anti-fibrotic activity, cytotoxicity, and selectivity index of matrine derivatives.

| Code | R | IC50 (μM) a | CC50 (μM) b | SI c | 13S/13R ratio d | ClogP e |
|---|---|---|---|---|---|---|
| 2a | R1 = Me, R2 = H | 65.3 ± 4.2 | 609.3 ± 29.8 | 9.3 | pure 13S | 0.75 |
| 2b | R1 = R2 = Me | 92.1 ± 1.9 | 624.5 ± 13.2 | 6.8 | pure 13S | 1.33 |
| 2c |

|
255.8 ± 22.1 | 675.8 ± 49.1 | 2.6 | 2.6:1 | 1.89 |
| 2d |

|
138.4 ± 9.8 | 507.2 ± 25.3 | 3.7 | 2.4:1 | 0.92 |
| 3a | H | 28.3 ± 3.9 | 106.6 ± 5.9 | 3.8 | 8.1:1 | 3.28 |
| 3b | 3′-Me | 39.0 ± 0.6 | 95.1 ± 6.5 | 2.4 | 5.7:1 | 3.78 |
| 3c | 4′-OMe | 44.7 ± 3.6 | 56.7 ± 3.9 | 1.3 | 4.9:1 | 3.34 |
| 3d | 4′-NO2 | 4.3 ± 0.4 | 32.8 ± 2.7 | 7.6 | 10.1:1 | 3.11 |
| 3e | 5′-OMe | 68.1 ± 5.5 | 127.5 ± 1.4 | 1.9 | 7.3:1 | 3.34 |
| 3f | 5′-Cl | 3.3 ± 0.3 | 26.7 ± 0.7 | 8.0 | pure 13S | 4.03 |
| 3g | 5′-Br | 6.5 ± 1.2 | 18.2 ± 0.6 | 2.8 | 4.9:1 | 4.18 |
| 3h | 5′-CN | 72.1 ± 4.0 | 153.6 ± 11.0 | 2.1 | 1.6:1 | 2.81 |
| 3i | 5′-NO2 | 14.5 ± 1.0 | 65.4 ± 3.1 | 4.5 | 3.3:1 | 3.11 |
| 3j | 5′-aza | 16.7 ± 3.5 | 114.0 ± 5.9 | 6.8 | pure 13S | 1.98 |
| 3k | 6′-F | 23.1 ± 5.3 | 78.1 ± 3.4 | 3.4 | 1.9:1 | 3.46 |
| 3l | 6′-Cl | 27.0 ± 1.4 | 45.8 ± 1.1 | 1.7 | 4.9:1 | 4.03 |
| 3m | 6′-NO2 | 19.3 ± 2.2 | 53.3 ± 1.9 | 2.8 | 11.5:1 | 3.11 |
| 3n | 6′-aza | 69.5 ± 8.2 | 84.2 ± 2.2 | 1.2 | 1.5:1 | 1.98 |
| Matrine | - | 878 ± 68 | 2466 ± 103 | 2.8 | - | 1.36 |
| Sophocarpine | - | 1186 ± 135 | 3160 ± 355 | 2.7 | - | 1.36 |
| Pirfenidone | - | 1320 ± 98 | 4159 ± 239 | 3.1 | - | 2.40 |
a. Inhibition of TGF-β1 induced total collagen accumulation in MRC-5 cells; b. 50% cytotoxic concentration; c. Selectivity index (SI = CC50/IC50); d. the ratio of 13S isomer vs. 13R isomer, determined by 1H-NMR spectra; e. ClogP (Calculated log partition coefficient) calculated using ChemDraw Professional.
