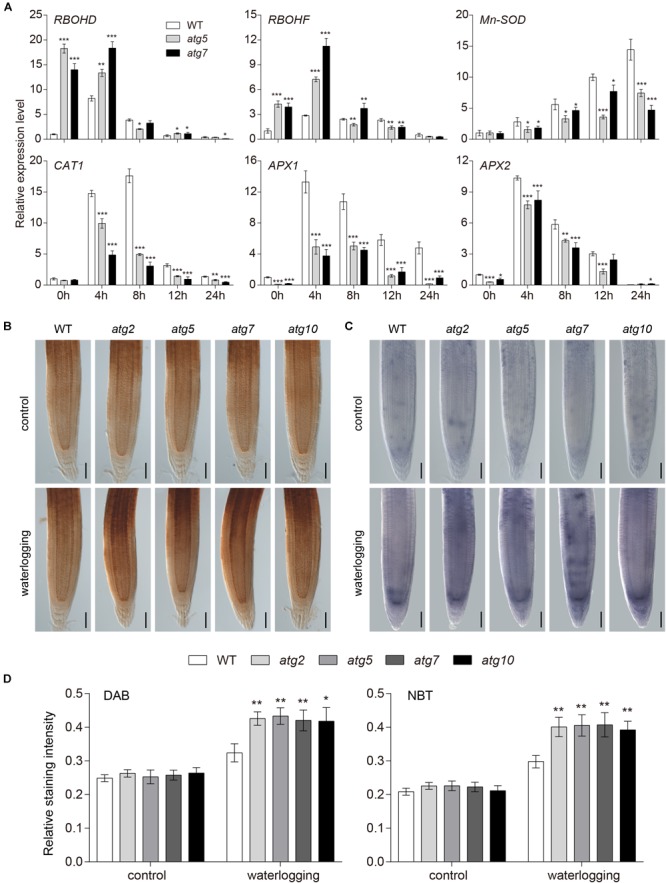
FIGURE 6.

Accumulation of ROS increased in atg mutants after waterlogging. (A) Relative expression levels of genes encoding enzymes involved in production or reduction of ROS in the wild-type and atg mutants after waterlogging treatment. (B) DAB staining for H2O2 and (C) NBT staining for superoxide anion in primary root of wild-type and atg mutants after waterlogging treatment. Bars = 50 μm. (D) Relative staining intensities calculated from (B–C). All of the experiments have been repeated at least three times. Data shown are the mean ± SD (n = 3). ∗P < 0.05; ∗∗P < 0.01; ∗∗∗P < 0.001 by Student’s t-test.
