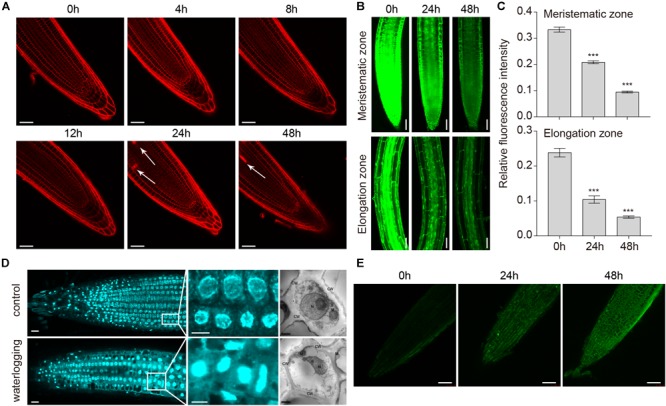
FIGURE 7.

Programmed cell death in roots of A. thaliana induced by waterlogging. (A) Confocal images of wild-type roots stained with propidium iodide (PI). Arrows indicate the cell death. Bars = 50 μm. (B) Confocal images of the detection of cell viability in primary roots. Bars = 50 μm. (C) Meristematic and elongation zones of wild type of FDA staining intensity are quantified by Image pro plus 6.0 software. (D) Confocal images and TEM images of the detection of nucleus in primary roots with or without waterlogging treatment. CW, cell wall; M, mitochondrion; N, nucleus; G, Golgi body. Bars = 50 μm. (E) TUNEL assay of DNA fragmentation (stained in green) in root tip cells of wild-type seedlings. Bars = 50 μm. All of the experiments have been repeated at least three times. Data shown are the mean ± SD (n = 3). ∗P < 0.05; ∗∗P < 0.01; ∗∗∗P < 0.001 by Student’s t-test.
