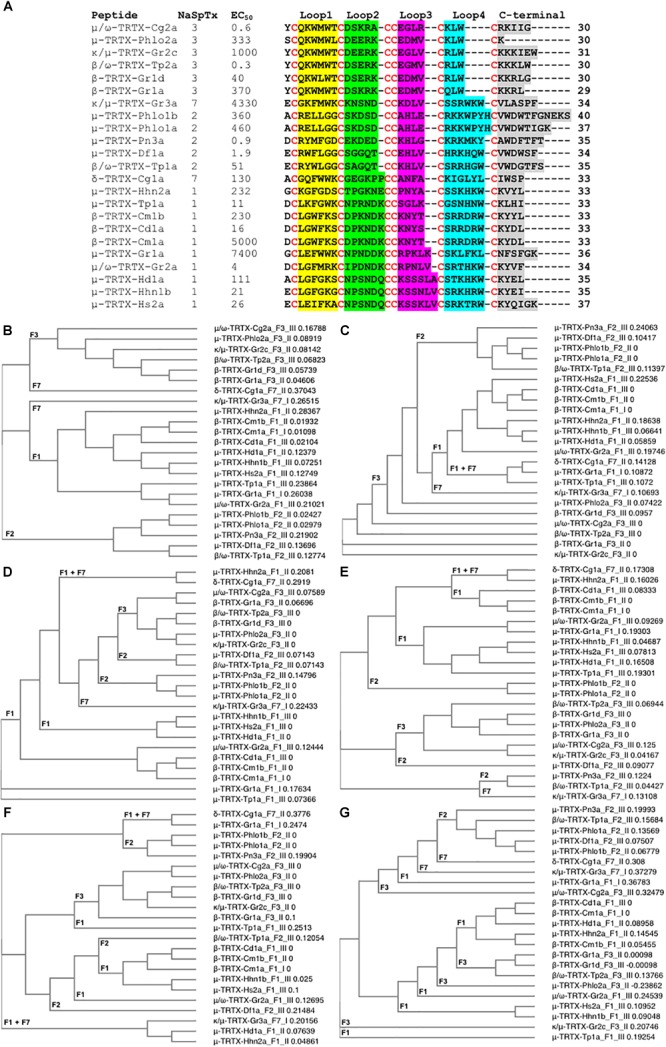
FIGURE 5.

Primary amino acids sequence alignment and phylogenetic analysis of NaSpTx peptides with described NaV1.7 modulatory activity. (A) Primary sequences alignment of members of NaSpTx1, 2, 3, and 7, with EC50 values represented in nM, Loops, 1, 2, 3, 4, and C-terminal shaded in yellow, green, pink, (blue and gray, respectively, and cysteines colored in red. (B) Phylogenetic analysis of the full primary sequences of NaSpTx NaSpTx1, 2, 3, and 7, followed by Loop 1 (C), Loop 2 (D), Loop 3 (E), Loop 4 (F), and C-terminals (G). For the phylogenetic trees, the peptides names are followed by their respective NaSpTx families represented by F1, F2, F3, and F7, and their NaV1.7 potency represented by I (EC50 > 1 μM), II (EC50 between 1 and 0.1 μM), and III (EC50 < 0.1 μM). These analyses were performed using Clustal Omega (Sievers et al., 2011) and Simple Phylogeny (Saitou and Nei, 1987). The loops were flanked by cysteine for these analyses.)
