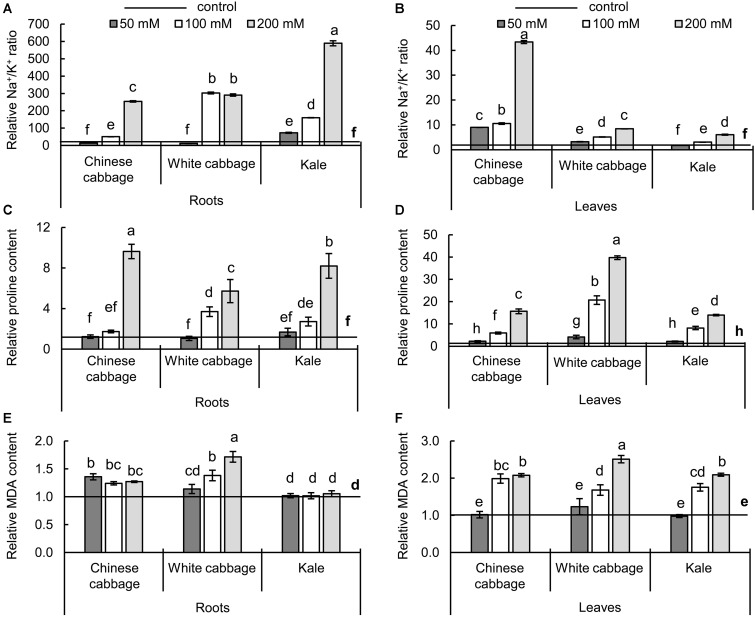
FIGURE 4.
Na+/K+ ratios (A,B), and contents of proline (C,D), and malondialdehyde (MDA) (E,F) of the three Brassica crops in roots (left panels) and leaves (right panels) after exposure to 50, 100, and 200 mM NaCl, relative to NaCl-free controls. Normalized values of salt treatments presented as means ± SD, n = 4. Points labeled with different letters differ significantly at p < 0.05. Raw data are presented in Supplementary Table S2.

