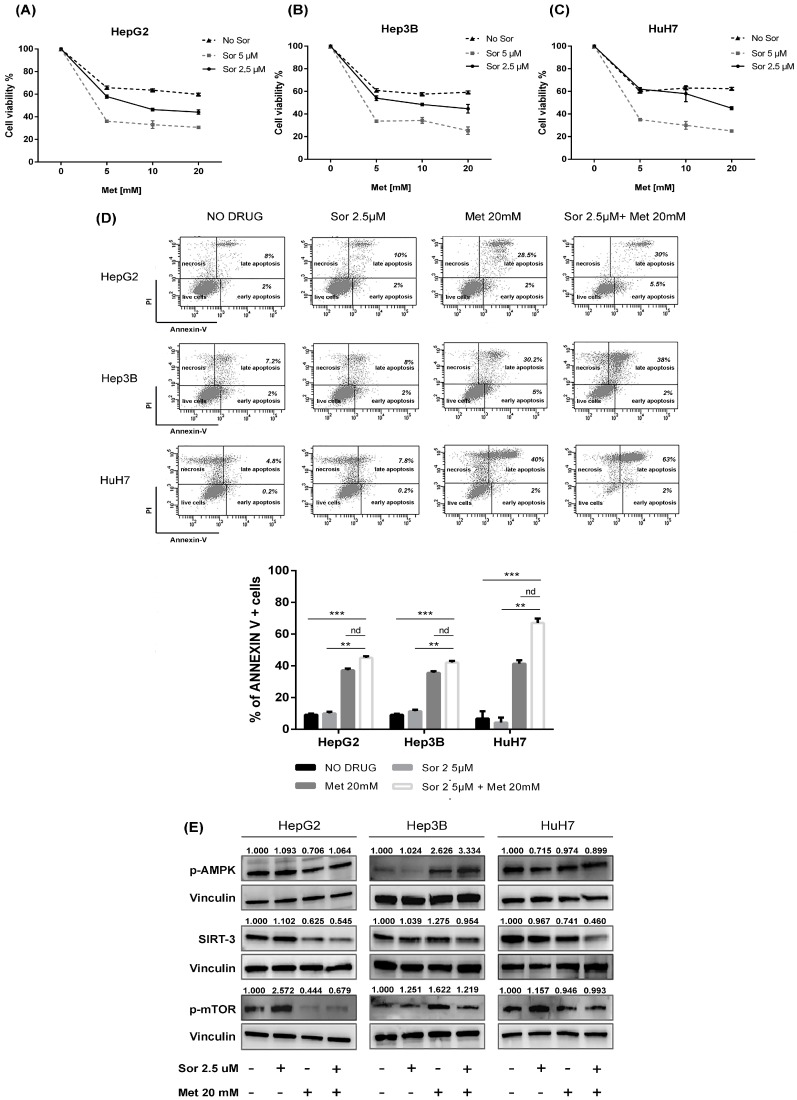
Figure 3.
The in vitro effect of metformin and sorafenib on HCC cell lines. MTT assay for cell survival assessment in three HCC cell lines: (A) HepG2; (B) Hep3B; and (C) HuH7, before and after treatment with metformin (Met) [0–20 mmol/mL] alone and in combination with sorafenib (Sor) [2.5 and 5 µmol/mL] for 48 h. (D) Dot plots and relative quantification of annexin V+ cells (early and late apoptosis) in HCC cell lines treated with DMSO (NO DRUG), Met at 20 mmol/mL and Sor at 2.5 µmol/mL used alone and in combination for 48 h. For all experiments, values represent the mean ± SD of three biological replicates (** p < 0.01, *** p < 0.001). (E) Representative immunoblots showing the expression of p-AMPK, SIRT-3 and p-mTOR and relative quantified values of the bands after treatment with Met 20 mM and Sor 2.5 µM alone and in combination for 48 h in HepG2, Hep3B and HuH7 cell lines. Vinculin was used as loading control.

