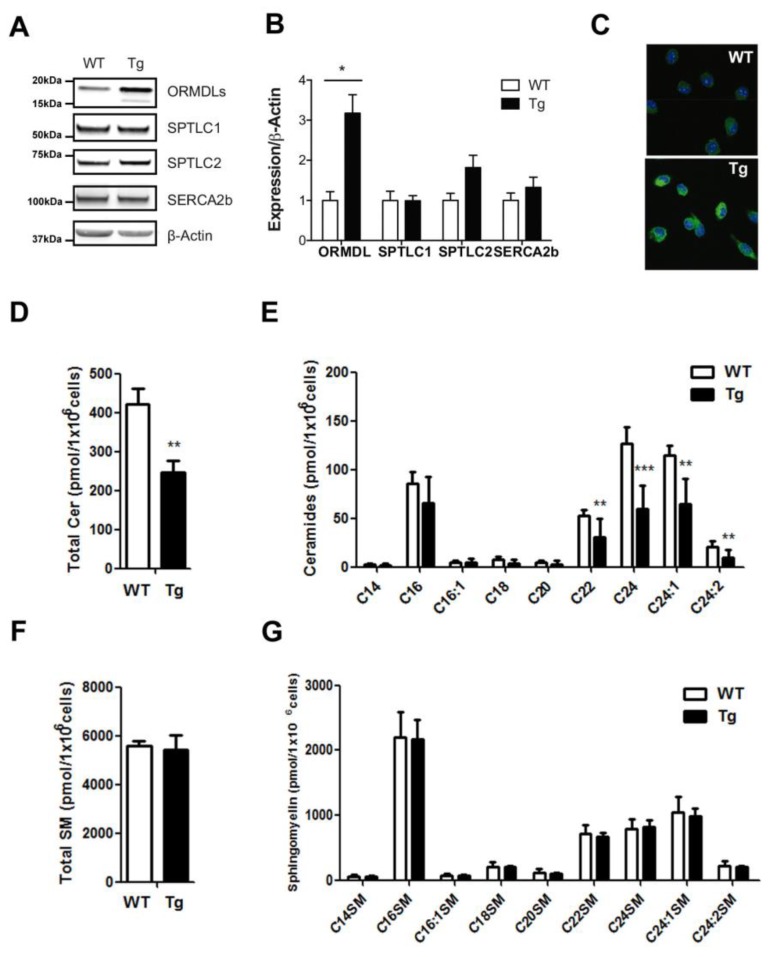
Figure 1.
Ceramide content of macrophages in hORMDL3Rosa26 mice. (A,B) Western blot in wild type (WT) and transgenic (Tg) mice of SERCA2b, SPTLC1, SPTLC2, ORMDLs, and actin, using 50 µg of protein from bone-marrow-defined-macrophages (BMDM). (A) Representative Western blot; (B) graph with quantification analysis normalized to actin. Statistics: n = 4; Mann-Whitney test; * p < 0.05; (C) immunostaining using anti-ORMDL antibody (green) and TO-PRO-3 (blue) of BMDM from WT and Tg mice; (D,E) Ceramide content in BMDM macrophages from WT and hORMDL3Rosa26 (Tg) mice, quantified by mass spectrometry. (D) Graph with total ceramide content. (E) Contribution of the different ceramide species. (F) Graph with total sphingomyelin content. (G) Contribution of the different sphingomyelin species. Statistics (D–F): WT n = 13, Tg n = 11; Mann-Whitney test; * p < 0.05; ** p < 0.01; *** p < 0.01. Error bars represent standard error.

