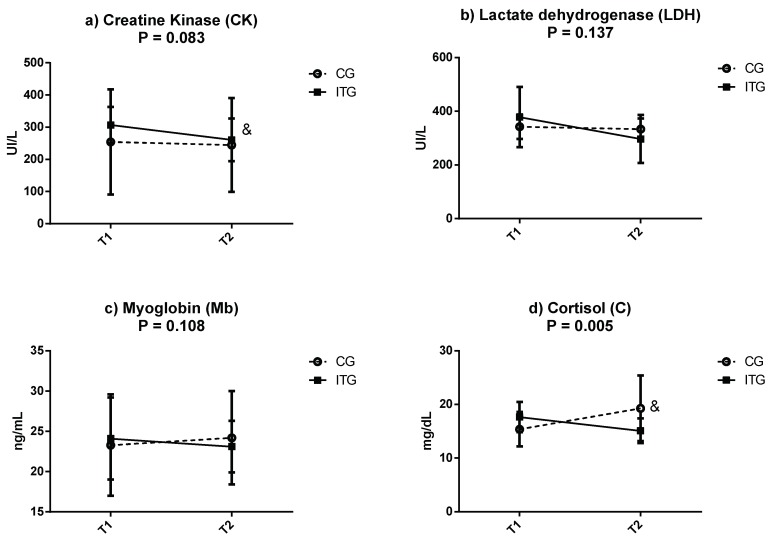
Figure 2.
Concentrations of (a) creatine kinase (CK), (b) lactate dehydrogenase (LDH), (c) myoglobin (Mb) and (d) cortisol (C) in the control group (CG) and in the iron treated group (ITG) at the beginning (T1) and at the end of intervention (T2). Data are expressed as mean ± standard deviation. P: group-by-time interaction (p < 0.05, all such occurrences). Two-factor repeated-measures ANOVA. &: Significantly different between phases as determined by dependent t-test (T1 vs. T2), p < 0.05.

