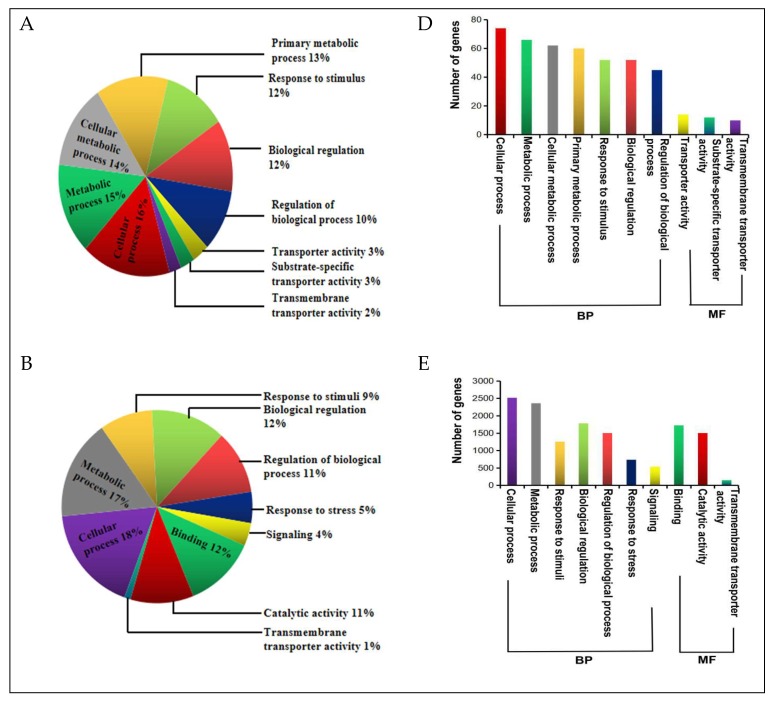
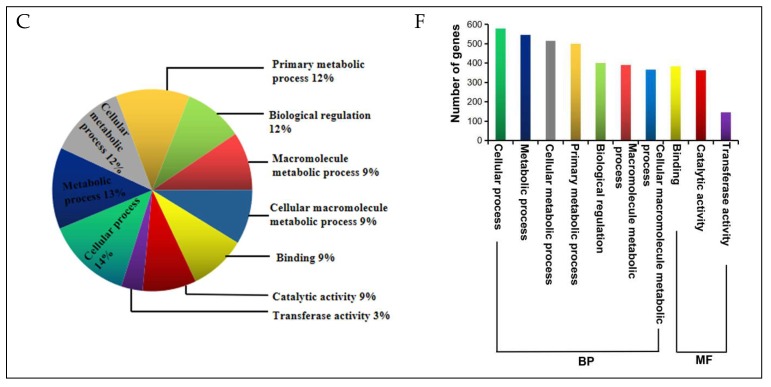
Figure 4.
Gene ontology (GO) enrichment analysis of the DEGs (from the critical areas labelled I, II, and V in Figure 2) in specific level 2 GO terms. The GO analysis results shown here are for the top 10 GO terms from the biological processes (BP) and molecular functions (MF) categories combined, for (A) GO enrichment of DEGs corresponding to tolerant treatment response (TC_TD); (B) GO enrichment of DEGs corresponding to line response under drought (SD_TD); and (C) GO enrichment of DEGs corresponding to sensitive treatment response (SC_SD); (D–F) Number of DEGs enriched in each specific GO term in each experimental comparison (TC_TD, SD_TD, and SC_SD, respectively). Each area contained a background total of 80, 5140, and 602 DEGs, for TC_TD, SD_TD, and SC_SD, respectively.


