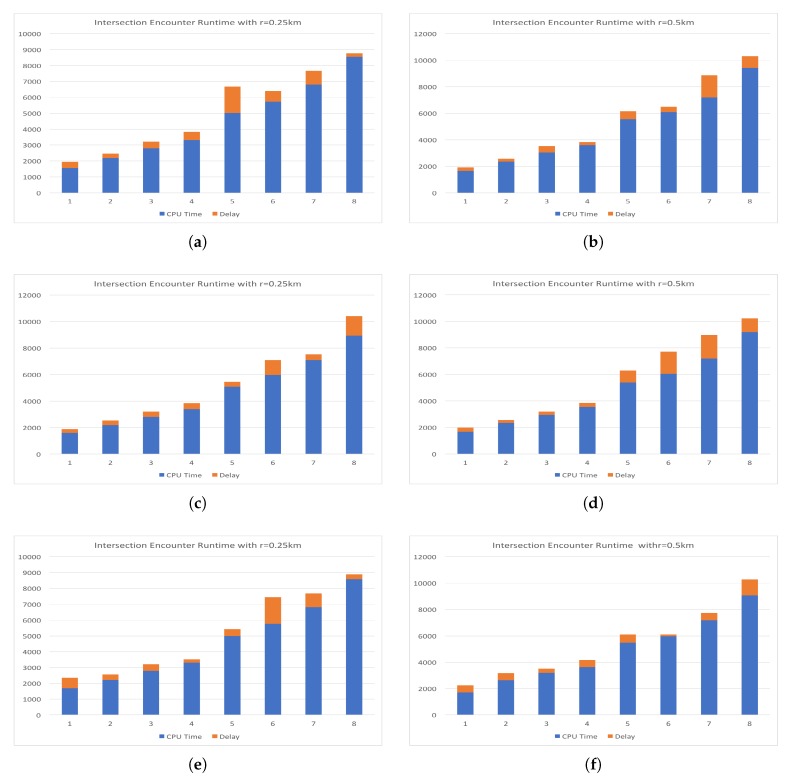
Figure 8.
Comparison of CPU time and round trip communication delay for geographically dispersed resources. The sum of the bar segments is equal to the total time for the request to be sent, processed, and results returned. Figures (a) and (b) illustrate the run time and delay for requests sent to the “east” server, (c) and (d) the “central”, (e) and (f) the “west”, and finally (g) and (h) the “cin” server.


