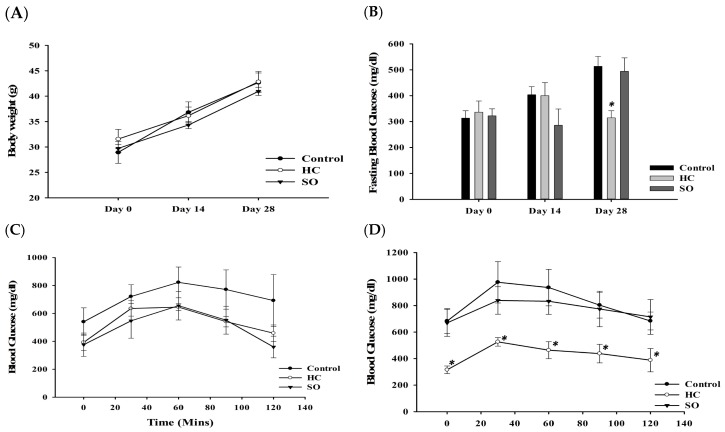
Figure 3.
Effects of HC and SO in C57BKSdb/db mice (N = 5). (A) Changes in body weight. (B) Changes in fasting blood glucose (FBG) after treatment with HC and SO for 14 days and 28 days. (C) Oral glucose tolerance test (OGTT) after administration of HC and SO for 14 days. (D) OGTT after administration of HC and SO for 28 days. Significant difference between the control-treated group at * p < 0.05, by one-way ANOVA.

