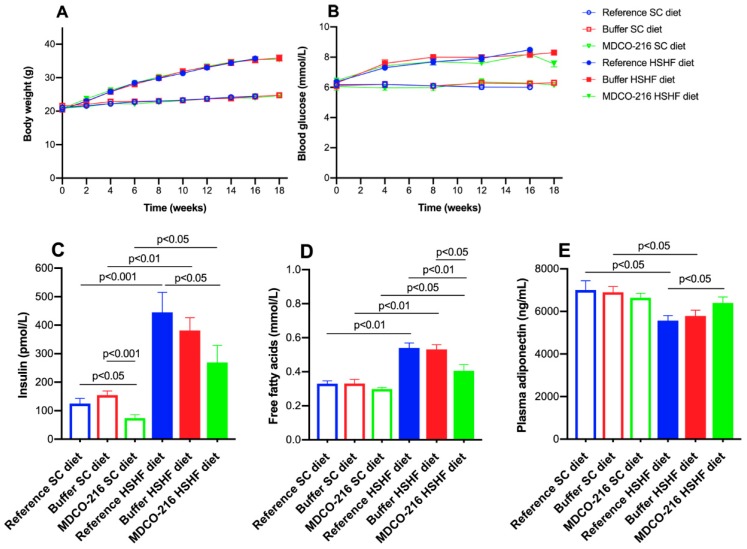
Figure 4.
Time course of body weight (A) and blood glucose levels (B) in reference, buffer, and MDCO-216 C57BL/6N mice fed the SC diet or the HSHF diet. Plasma insulin (C), free fatty acids (D), and adiponectin (E) levels at the time of sacrifice. Week 0 in panels A and B corresponds to the age of 12 weeks, the start of the HSHF diet. All data represent mean ± SEM (n = 15 for SC diet groups; n = 20 for HSHF diet groups).

