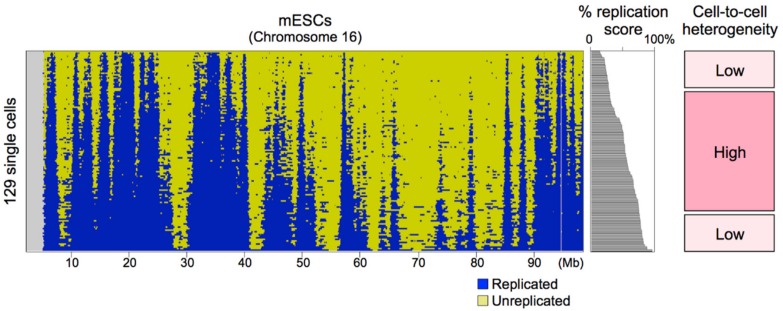
Figure 3.
Binarized scRepli-seq profiles of 129 mESCs throughout the S-phase. Data sets were sorted according to the percentage of the genome replicated in each cell. While replication timing heterogeneity was variable among domains, its average was constant and relatively high during the mid S-phase. In contrast, heterogeneity at the beginning and the end of S-phase was much smaller and less variable than mid-S. Figure was adapted from Takahashi et al. [12].

