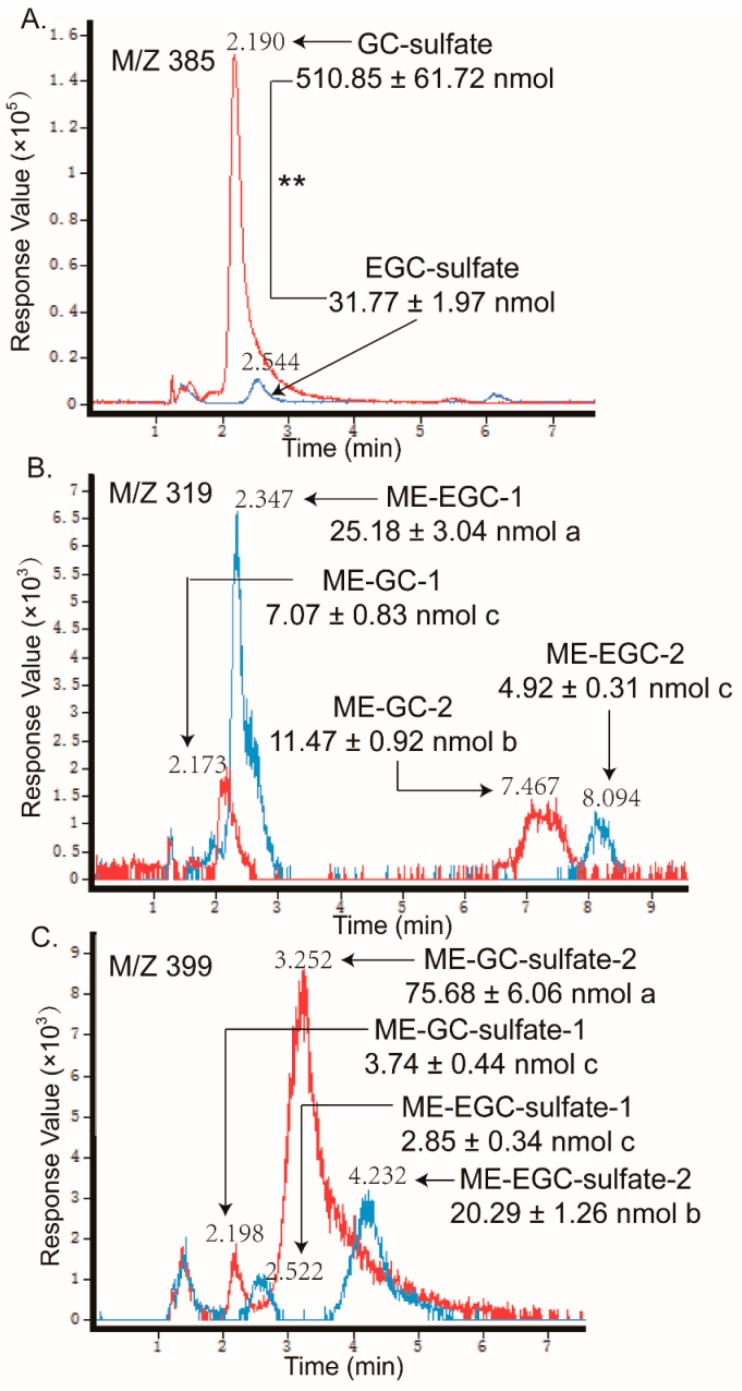
Figure 5.
LC chromatograms of the samples taken from apical sides after loading GC (line in red) and EGC (line in blue) in the basolateral side, obtained by negative ESI/MS interface extracted with (A) 385 [M − H]−, (B) 319 [M − H]−, and (C) 399 [M − H]−. The relative content of the catechin metabolites were measured as free-form equivalents, relative to the internal standard. Each value was the average of three different samples; ** indicates significantly different at a 0.01 level. The mean values with the same lowercase letters indicate no significant difference at a 0.05 level.

