Figure 6.
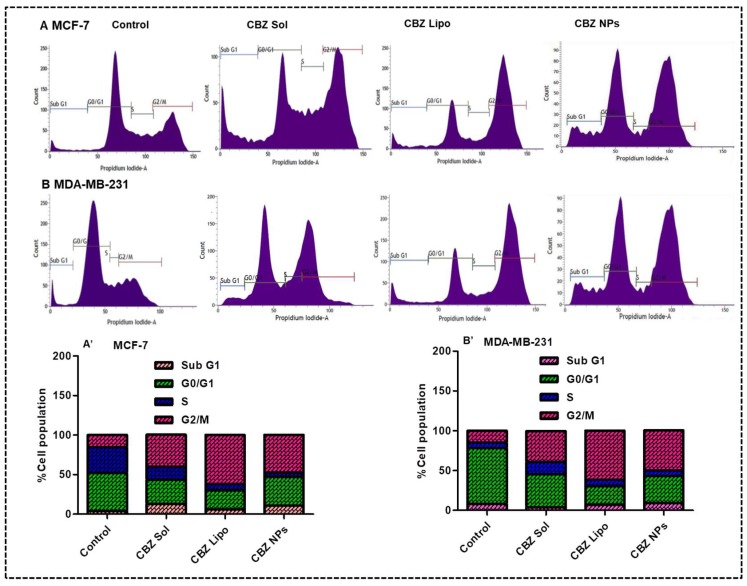
Inhibition of cell cycle and DNA damage checkpoints on MCF-7 and MDA-MB-231 cell lines: (A,B) representing flow cytograms of different phases of arrest in the cell cycle in MCF-7 and MDA-MB-231 cell lines treated with CBZ micellar solution, CBZ liposomes, and CBZ NPs, respectively, in comparison with control. (A′,B′) represent the percentage of cell population at different phases of arrest in MCF-7 and MDA-MB-231 cell lines treated with CBZ micellar solution, CBZ liposomes, and CBZ NPs, respectively, in comparison with control.

