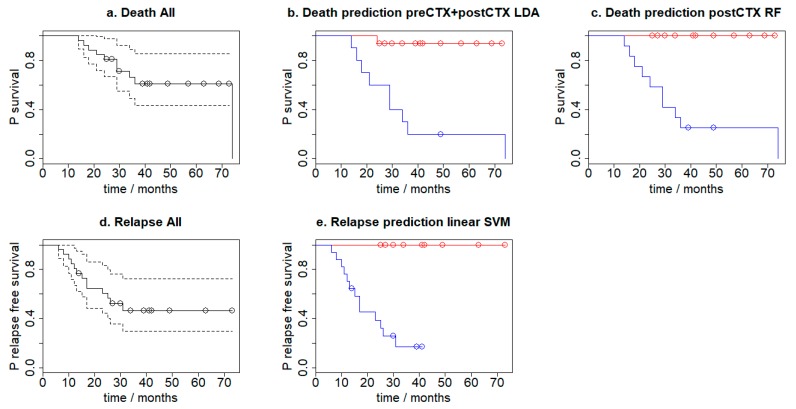
Figure 4.
Kaplan–Meier plots for (a) overall survival, overall survival according to leave-one-out cross-validation prediction using the (b) preCTX+postCTX LDA model (p = 0.00023) (c) postCTX RF model (p = 0.000197), (d) progression-free survival and (e) according to leave-one-out cross-validation prediction using the linear SVM model (p = 0.000387). In (b) and (c) red indicates those predicted to die, whilst blue are those predicted to live. In (e) red indicates those patients who are predicted to relapse, whilst blue are those predicted to not relapse.

