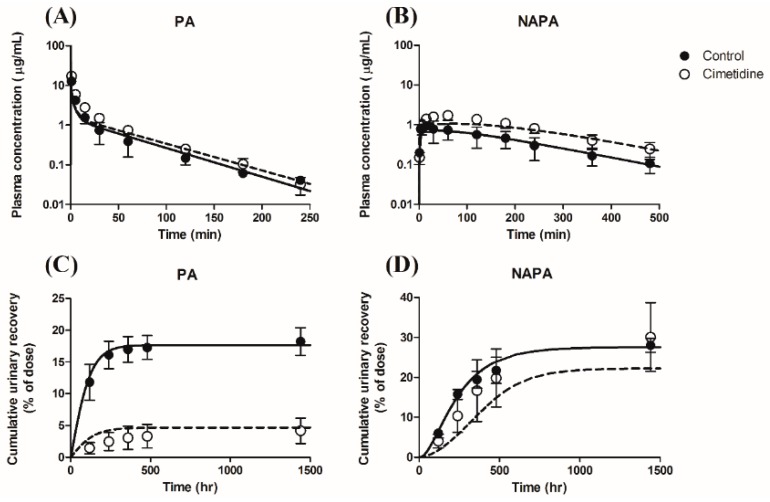
Figure 5.
Observed and simulated plasma concentration-time profiles (A,B) and urinary excretion profiles (Cumulative urinary recovery (% dose)) (C,D) for PA (A,C) and NAPA (B,D) after intravenous bolus administration of 10 mg/kg of PA HCl in the absence or presence of cimetidine. (Observed results from Figure 2). Closed circles and solid lines represent the observed and simulated (model fitted) results without cimetidine, whereas open circles and dashed lines represent the observed and simulated (predicted) results with cimetidine, respectively. Symbols represent the mean ± S.D.

