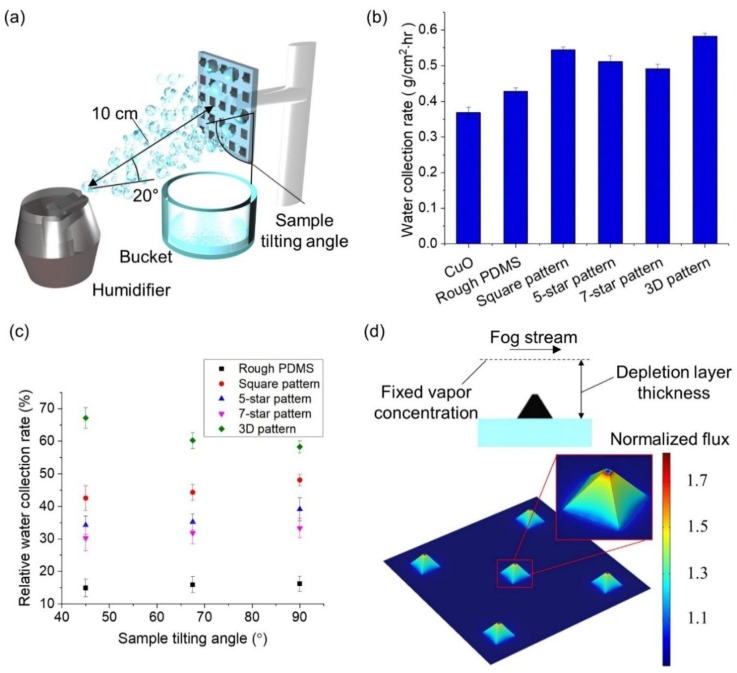
Figure 3.
A schematic illustration of the experiment setup to measure the WCR and plots of the experimental and numerical results. (a) A schematic illustration of the setup used to measure the WCR of different samples. (b) The WCRs of different samples with a 90° sample tilting angle, including CuO, rough PDMS control samples and 2D square, 5-star, 7-star pattern samples and 3D pattern sample. (c) The relative WCRs of different samples with three different sample tilting angles of 45°, 67.5°, and 90°. (d) The FEA plot of the diffusion flux over the 3D pattern sample assuming a fog stream in parallel to the surface. The inset images show the conditions of FEA and the magnified plot over a 3D bump.

