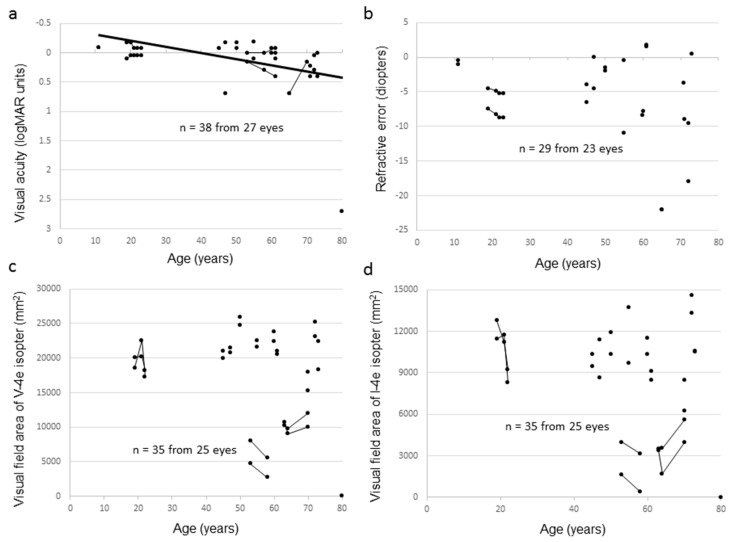
Figure 3.
Correlation between visual function and age among carrier female subjects in this study. The graphs show visual acuity values expressed in logMAR units (a), refractive error (b), visual field extent with the V-4e isopter (c), and visual field extent with the I-4e isopter (d) versus age. The data from the same subject are indicated using bars connecting the points.

